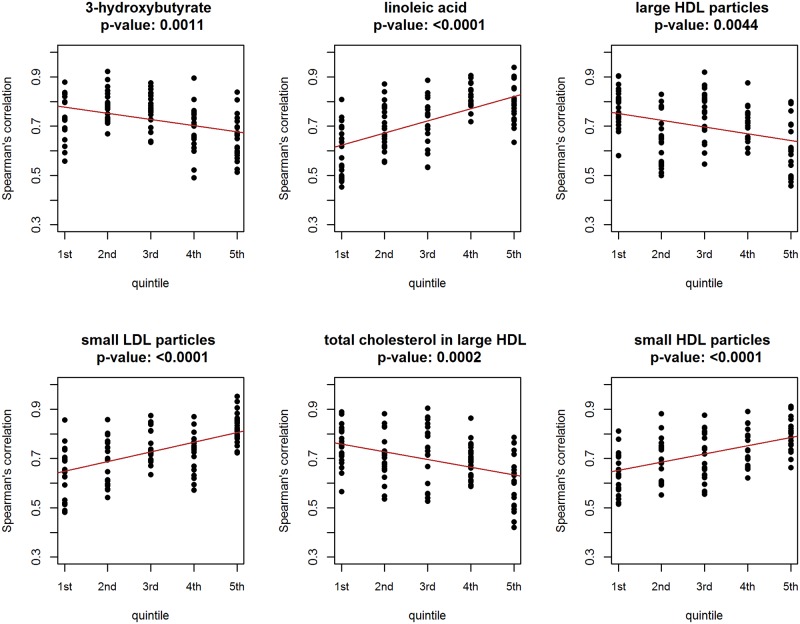
Fig 6. Results of the linear-regression-based investigation of conditional co-expression.
Dots represent the estimated Spearman’s correlation coefficients for the five metabolic subsets (defined by quintiles of the metabolite); the fitted regression line is drawn in red. Benjamini and Yekutieli adjusted p-values are reported.

