
Figure 1.
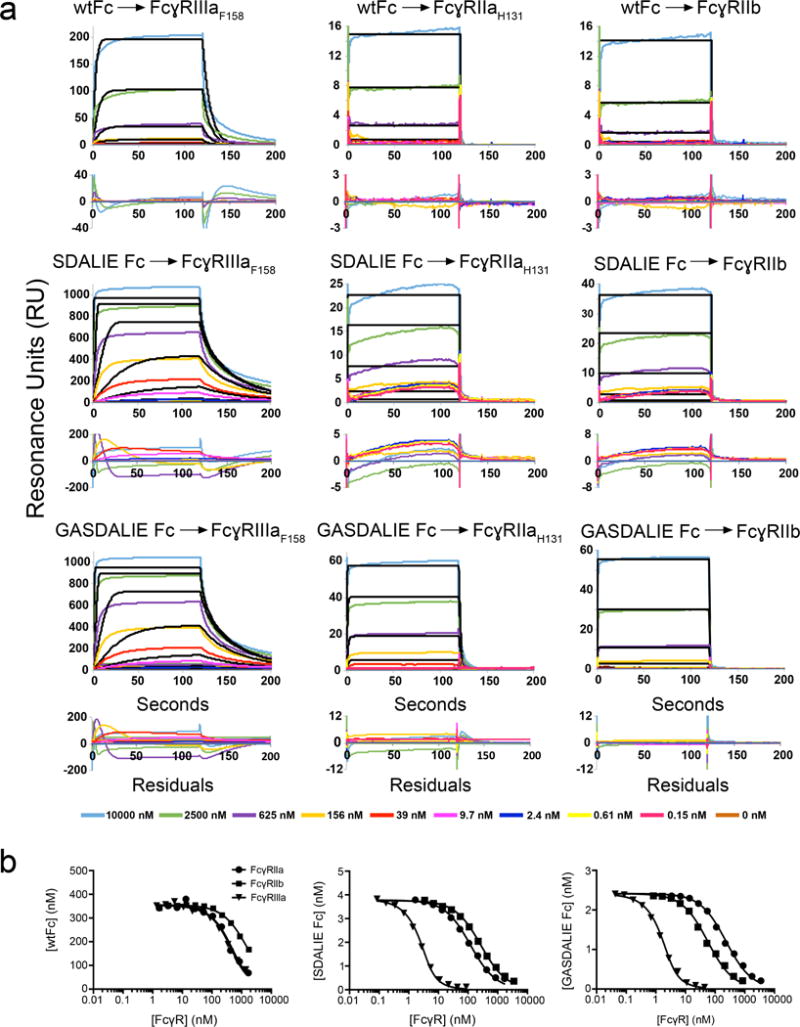
SPR binding assays of Fc:FcγR interactions. (a) Sensorgrams from conventional SPR experiments in which Fc proteins were injected over immobilized FcγRs. Experimental data (colored lines) were fit to a 1:1 binding model (black lines). Residual plots are shown below each set of sensorgrams. For most interactions, the association and/or dissociation phases of the sensorgrams do not fit a 1:1 binding model. In cases in which the association and dissociation rates are very fast, the 1:1 binding model appears to fit the sensorgrams, but the kinetic rate constants are outside of the detectable range of the instrument and the equilibrium RU values do not converge as the concentration of analyte is raised. (b) Competition SPR results. Equilibrium binding curves for interactions of the Fc variants (wtFc, SDALIE Fc, and GASDALIE Fc) with Fcγ receptors (FcγRIIIa, FcγRIIa, and FcγRIIb). Each curve represents an equilibrium binding experiment in which the free Fc concentration (y-axis) is plotted versus the competitor (FcγR) concentration (logarithmic x-axis). Data points (triangles, circles, or squares) were fit by non-linear regression to the second order root function to an equilibrium binding model (solid black line) as described in the Methods. The more a curve is shifted to the left, the stronger the Fc:FcγR binding (i.e., the higher the affinity).