
Figure 3.
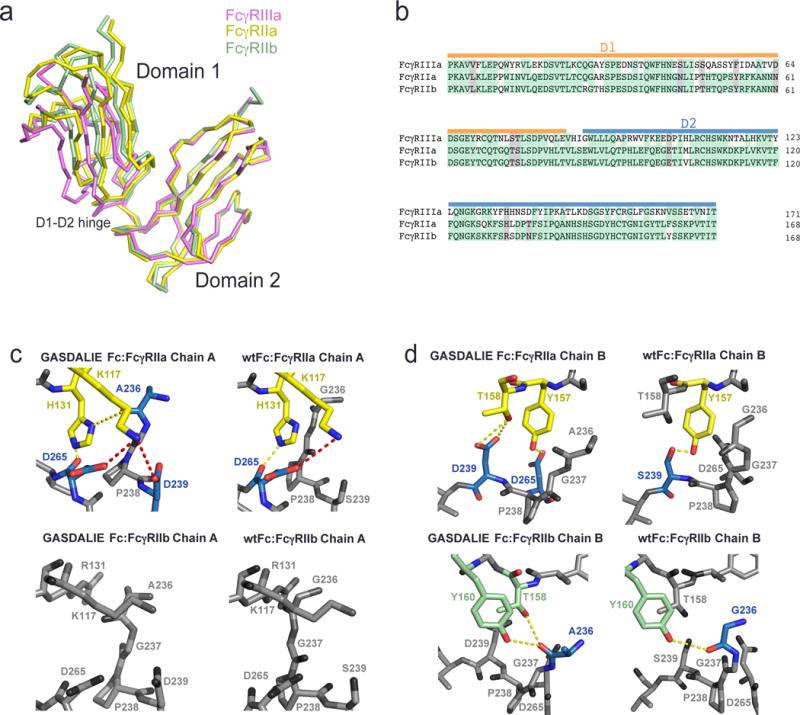
Comparison of the interfaces of FcγRIIa and FcγRIIb with GASDALIE Fc and wtFc using homology modeling. (a) Alignment of the D2 domains of FcγRIIa (PDB 3RY4, yellow), FcγRIIb (PDB 2FCB, green), and FcγRIIIa (pink; from the GASDALIE Fc:FcγRIIIa complex structure). (b) Sequence alignment of the D1 and D2 domains of FcγRIIa, FcγRIIb and FcγRIIIa. Identical residues are highlighted in green and similar residues are highlighted in gray. (c–d) Homology modeled interfaces of GASDALIE Fc and wtFc with FcγRIIa and FcγRIIb. Predicted electrostatic interactions (red) and hydrogen bonds (yellow) are shown as dashes. Residues that are not predicted to participate in the Fc:FcgR interfaces are shown in gray. (c) Interactions of chain A of GASDALIE Fc (left) and wtFc (right) with FcγRIIa (top) and FcγRIIb (bottom). (d) Interactions of chain B of GASDALIE Fc (left) and wtFc (right) with FcγRIIa (top) and FcγRIIb (bottom).