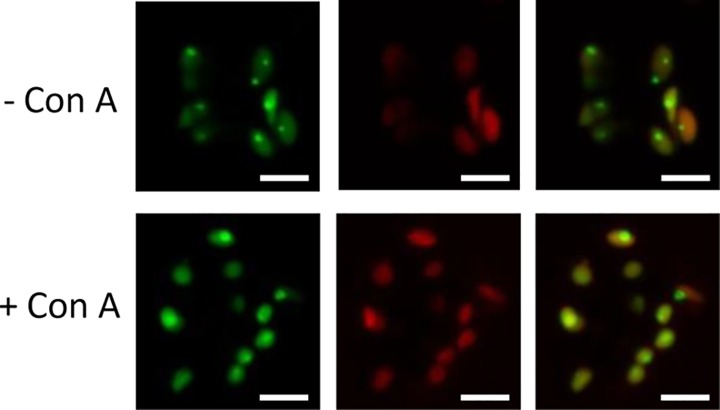
Fig 7. Effect of concanamycin A on DXR-GFP localization.
Pictures show representative images of GFP fluorescence (left columns), chlorophyll autofluorescence (central columns), or both (right columns) in guard cells of 35S:DXR-GFP (H line) plants either exposed (+) or not (-). to 10 μM concanamycin A for 24 h. Bars = 5 μm.

