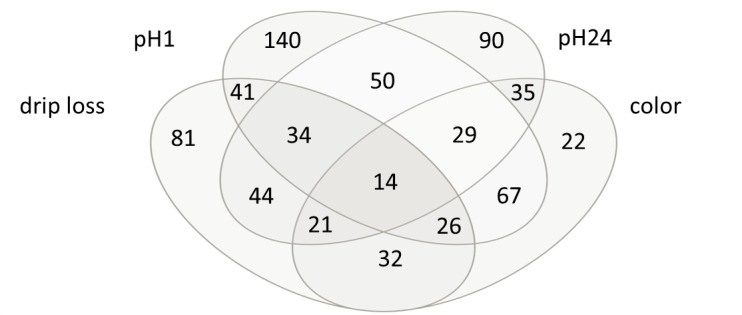
Fig 6. Venn-diagram of significant metabolites by random forest regression of Strobl et al. (2009) [29].

Drip loss measured in Musculus longissimus dorsi (LD) 24 h post-mortem (p.m.); pH1 measured in LD 45 minutes p.m.; pH24 measured in LD 24 h p.m.; color = meat color measured in LD 24 h p.m.
