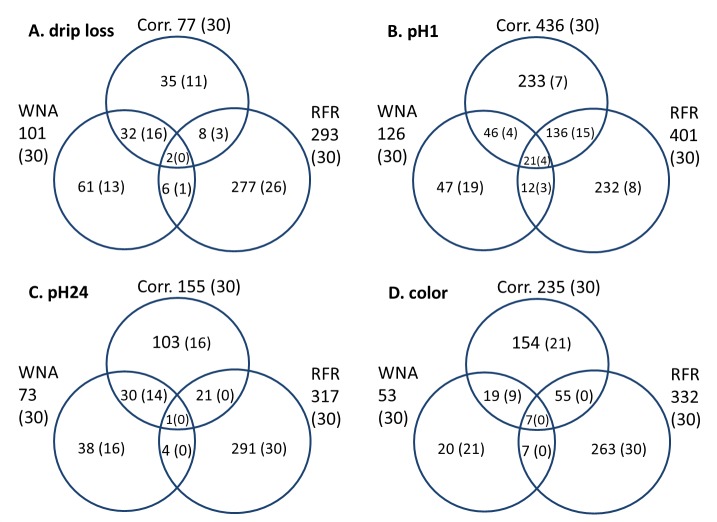
Fig 7. Venn-diagram of the entire significant metabolites for drip loss, pH1, pH24 and color identified by correlation analysis, weighted network analysis and random forest regression and of the selection of 30 metabolites with highest absolute correlation coefficients, metabolite significance and variable importance values in brackets.
Corr. = correlation analysis; WNA = weighted network analysis; RFR = random forest regression; drip loss measured in Musculus longissimus dorsi (LD) 24 h post-mortem (p.m.); pH1 measured in LD 45 minutes p.m.; pH24 measured in LD 24 h p.m.; color = meat color measured in LD 24 h p.m.

