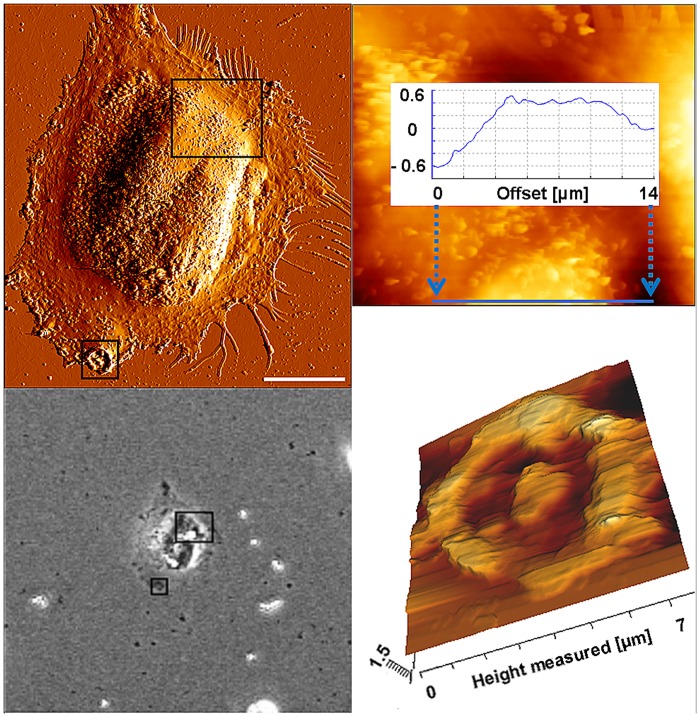
Fig 5. Location of MB after incubation with cells for 24 h.
AFM error signal (A) and a phase contrast image (B) of a single NIH 3T3 fibroblast after incubation with magnetic beads for 24 h. C) Section of the larger rectangle of 3 A and B in an AFM height image and a cross section (blue line) over one of the magnetic beads. Correlation between the images B and C show how magnetic beads were located within the cell around the nucleus. (D) AFM height image of the section of the smaller rectangle in Figs 5A and C shows the anchor region of a single magnetic bead at the cell periphery that was removed by the cantilever from the surface of the cell. Scale bar in A: 20 μm.

