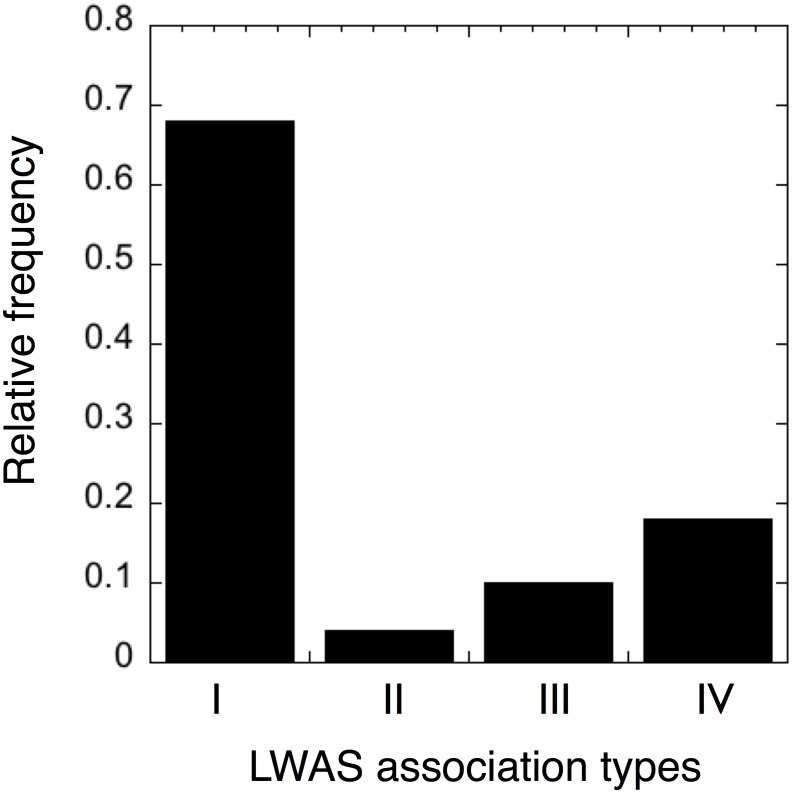
Fig 3. The relative distribution of LWAS association types.
Distribution of the top 105 highest-ranking implicit gene-disease pairs determined by manual inspection: Type I Gene family member (n = 71) represents gene-disease associations where a family member of the gene is causing the disease or a disease with very large phenotypic overlap; Type II Negation (n = 4) and Type III Homonym (n = 11) represent different classes of LWAS false positives composing 14% of the cases. Type IV Novel association (n = 19) indicates gene-disease associations of promise for follow up investigations.

