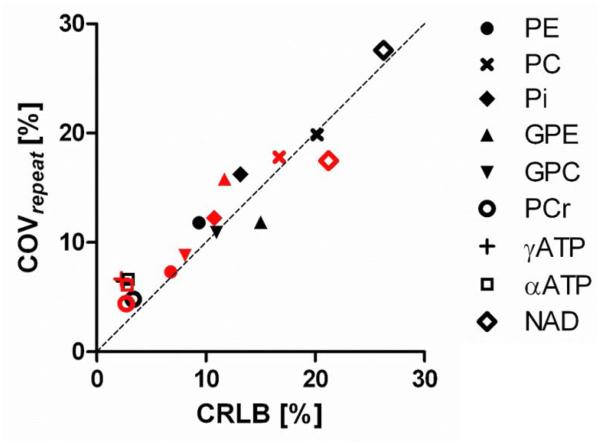
Figure 5.
Relation between fitting error of the metabolites (expressed in percentage Crémer-Rao Lower Bound, CRLB, average across subjects) and the relative repeatability (expressed in the coefficient of variation in repeated measurements, COVrepeat) of the metabolites. Black symbols: native. Red symbols: NOE-enhanced.

