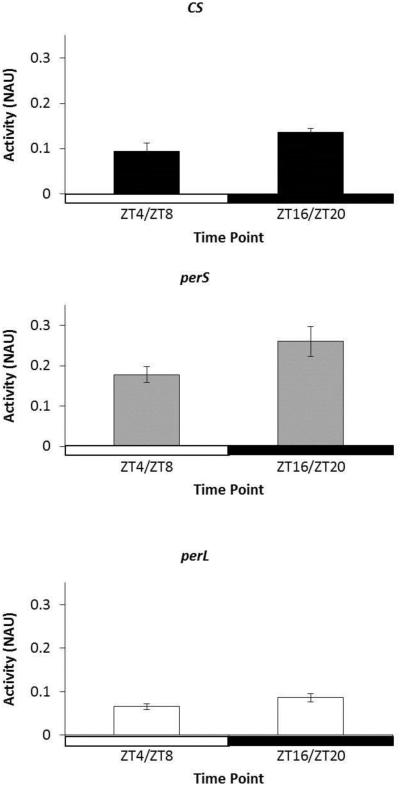
Figure 5. Day vs. Night alcohol dehydrogenase (ADH) activity in period mutants.
Comparison of ADH activity in 3-day-old wild type (CS), perS and perL flies during middle of light phase (ZT4 and ZT8) and middle of dark phase (ZT16, and ZT20). Each column represents mean ADH activity +/− standard error of at two time points in 3 biological replicates. ADH activity is represented as normalized absorbance units (NAU). NAU was calculated by normalizing the change in absorbance (ΔOD) due to accumulation of ADH-catalyzed NADH with the total protein concentration in each sample (BCA). X-axis is shaded clear and dark to depict light and dark conditions respectively. For each ADH activity assay five male flies were used.

