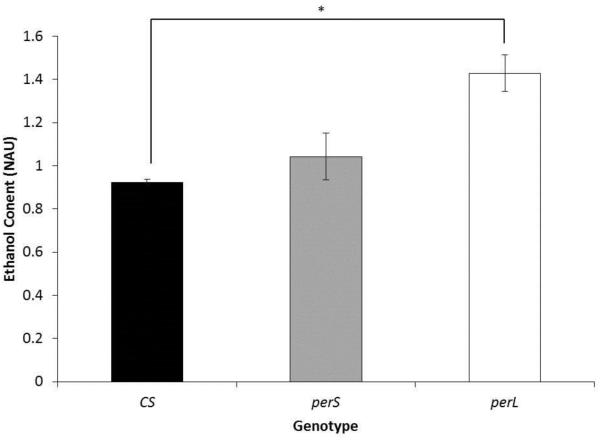
Figure 7. Ethanol pharmacokinetics in period mutants.
Comparison of ethanol content in 1-week-old wild type (CS), perS and perL flies. Flies were exposed to vapors generated by100% ethanol for 15 minutes at ZT4 followed by ethanol content assay at ZT5. Each column represents mean normalized ethanol content +/− standard error in 3 biological replicates. Ethanol content is represented as normalized absorbance units (NAU). NAU was calculated by normalizing the absorbance (OD) with the total protein concentration in each sample (BCA). For each ethanol content assay four male flies were used. *p<0.05; ANOVA, post hoc Scheffe.

