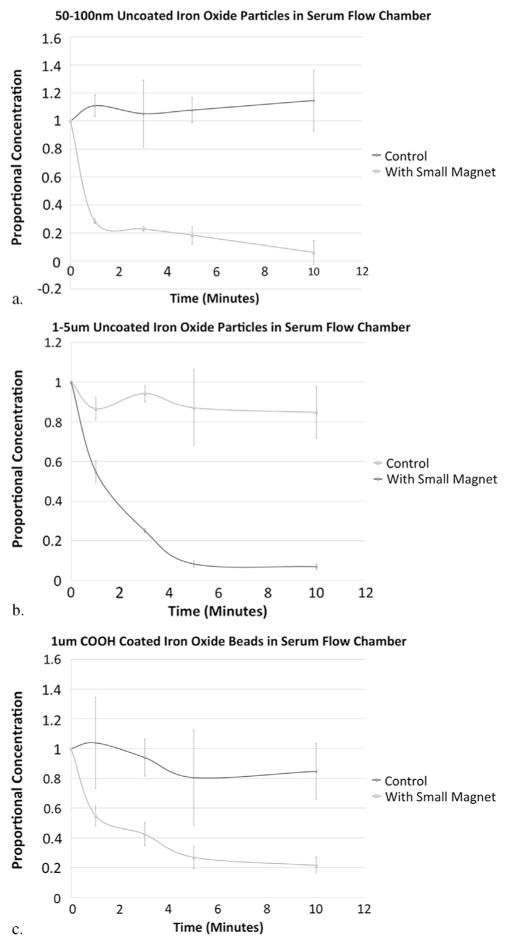
Figure 3.
Concentration curves (ie, proportion remaining in solution compared with time 0 for each run, with error bars representing standard deviation) from flow chamber experiments and corresponding control experiments for 50–100-nm uncoated iron oxide particles in serum (a), 1–5-μm uncoated iron oxide particles in serum (b), and 1-μm COOH-coated iron oxide beads in serum (c). The concentration decreased over time in the experiments with the large and small magnetic filtration devices compared with controls. The inconsistency in measurements during the control experiments may in part reflect heterogeneous mixing and clumping of the uncoated particles in solution.

