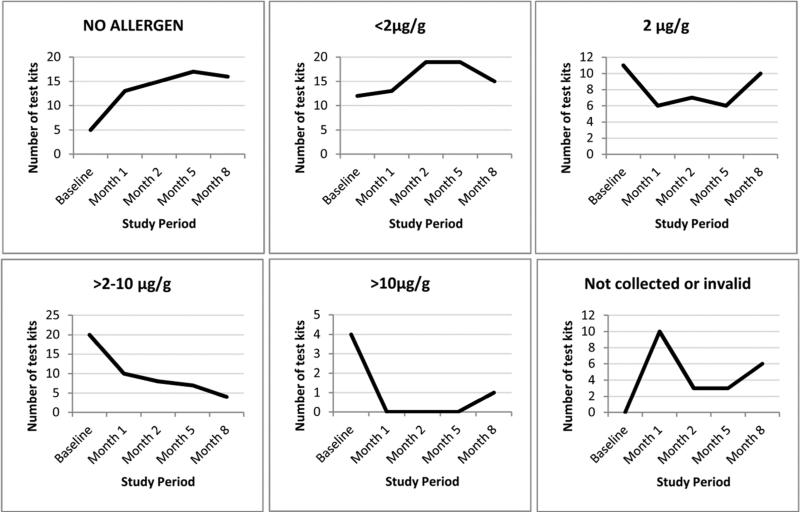
Figure 1.
Distribution of test kit based dust mite allergen concentrations (μg/g) by time point in the intervention group (bedroom bed and floor combined, N=52). The figure shows the number of test kits in each allergen category, and the number of kits that were not collected or were invalid over the study period. p-Value <0.01 for nonparametric sign test for the decline in dust mite levels from baseline to months 1, 2, 5 and 8 for floor. p-Value <0.01 for the decline in dust levels from baseline to months 2 and 5 in bed.

