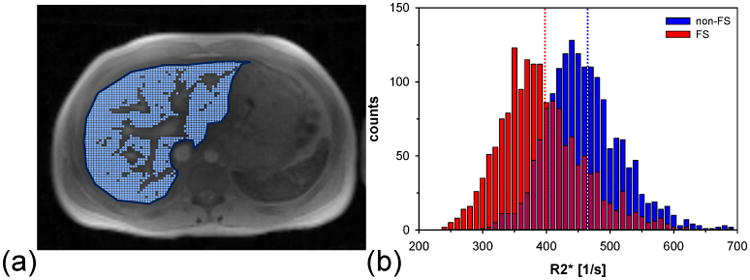
Figure 2.

Example of whole liver R2* measurement. (a) Manually selected whole liver ROI (dark blue) and included pixels (overlaid as light blue dots) based on histogram evaluation. Blood vessel were excluded from the R2* analysis. (b) Histogram of remaining R2* values for non-FS and FS mGRE acquisition. In this example R2* data obtained via fit (iii) are shown. The dotted lines indicate the respective mean R2* values. Note the clear shift in the FS R2* results to lower values.
