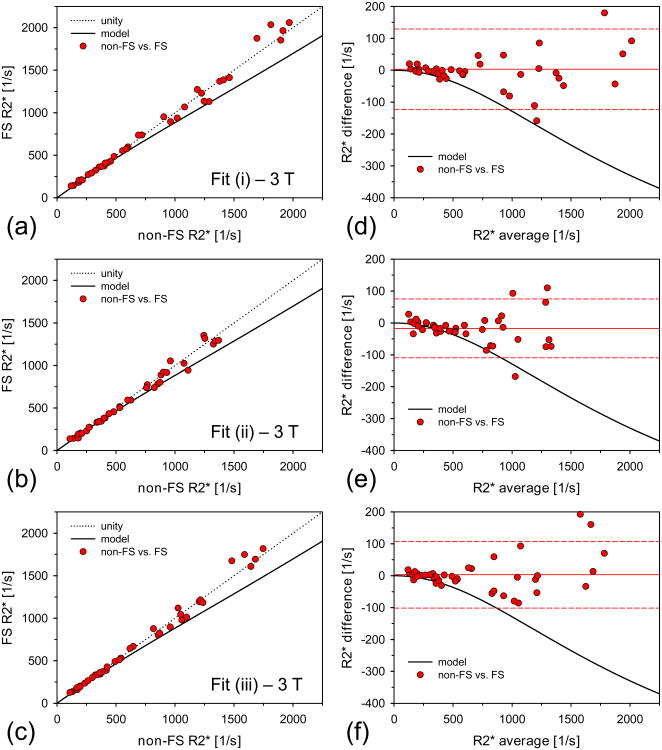
Figure 4.
Non-FS and FS R2* results at 3 T. (a)/(b)/(c) 3 T R2* results calculated via fit (i)/(ii)/(iii) for non-FS and FS acquisitions. The solid black line indicates the predicted R2* values due to the 3 T CHESS FS pulse according to our heuristic model (Eq. 2). The predicted R2* changes are not represented by the measured data. No correction of the 3 T FS R2* values was necessary. (d)/(e)/(f) Corresponding Bland-Altman plots for data shown in (a)/(b)/(c). The mean difference values are indicated as solid lines. The dashed lines represent respective limits of agreement (±1.96×SD of differences). Mean difference values and limits of agreement are given in Table 2.

