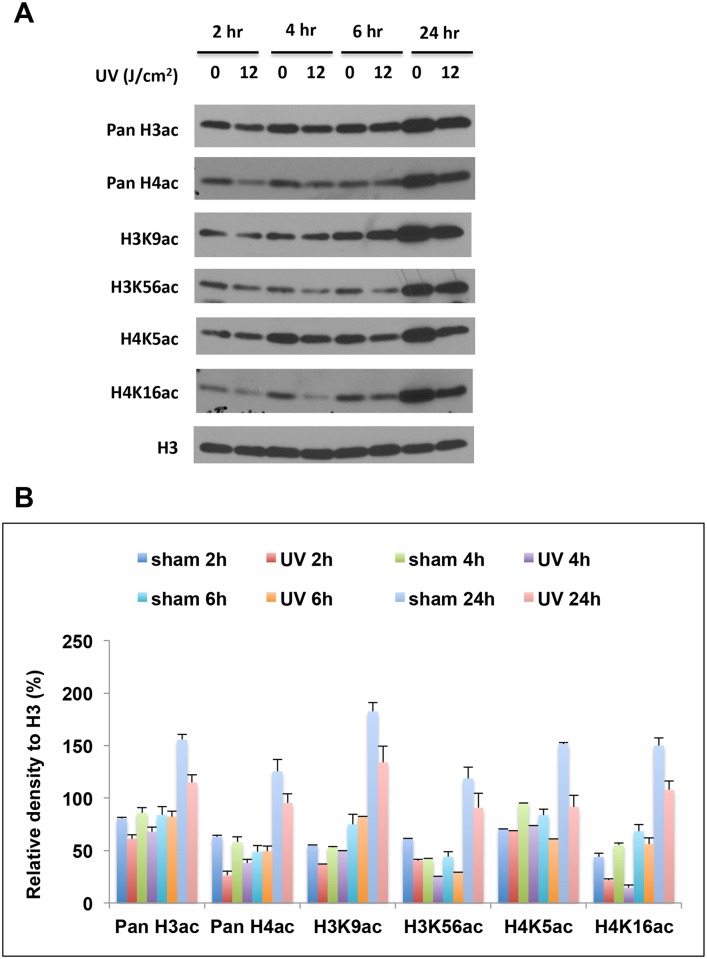
Fig 4. Time course of histone acetylation changes induced by ssUVR.
HaCaT cells were exposed to a single ssUVR at 12 J/cm2, and cells were harvested at 2-, 4-, 6- and 24-hours after irradiation. (A) Representative western blot. (B) The relative intensity of the bands was presented as the ratio of each band versus its corresponding H3. The results from replicate experiments were plotted as the mean ± SD (n = 3).

