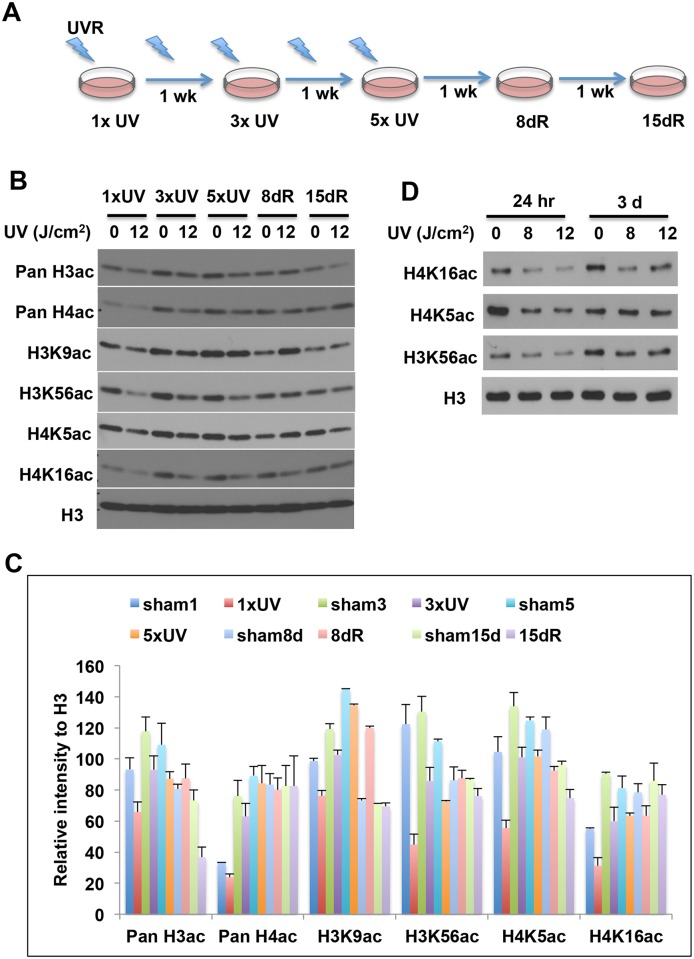
Fig 5. The persistence of histone acetylation following ssUVR exposure.
(A) Schematic diagram showing the ssUV radiation and recovery of HaCaT cells. (B) HaCaT cells were exposed to 5 repetitive ssUVR at 12 J/cm2 (once every three days), and then recovered for 15 days following the last irradiation. Cells were harvested at the indicated time intervals. (C) The relative intensity of the bands was presented as the ratio of each band versus its corresponding H3. The results from replicate experiments were plotted as the mean ± SD (n = 3). (D) NHEK cells were exposed to a single ssUVR at 8 or 12 J/m2, and cells were harvested at 24 hr or 3 days after irradiation. The levels of histone H3 and H4 acetylation were analyzed by western blot using specific antibodies. The relative intensity of the band was measured and is shown below each band. An antibody against histone H3 was used to access the loading of samples in each lane.

