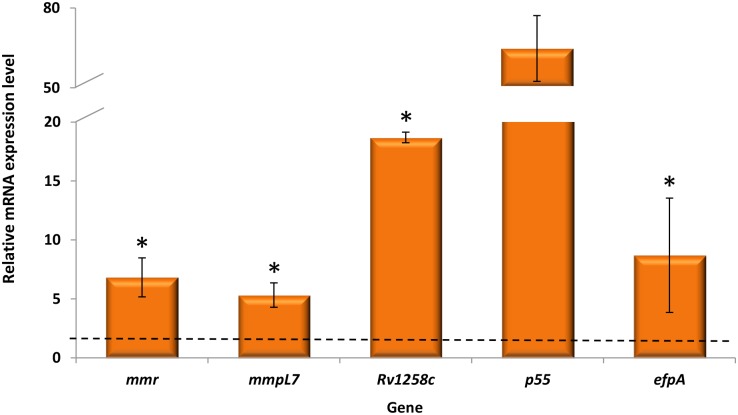
Fig 1. Analysis of intracellular M. tuberculosisefflux pump gene expression.
Bacterial efflux pump gene expression was analysed after the intracellular growth of M. tuberculosis strain 82/09 exposed to isoniazid at 0.1 μg/ml during three days. After this period, macrophages were lysed and RNA extracted from macrophage-grown bacilli using a GTC/Trizol based method. Relative expression of the five genes was determined by comparison of the relative quantity of the respective mRNA in the presence of isoniazid to the untreated control using the 2-ΔΔCt method. Data was normalized to the M. tuberculosis 16S rDNA reference gene and presented as the mean fold change (±SD) compared with the control (non-treated macrophage-grown bacilli). A level of relative expression equal to 1 (black dotted line in the graph) indicates that the expression level was identical to the non-exposed condition. Genes showing expression levels equal or above one, when compared with the non-exposed condition, were considered to be overexpressed. The assays were performed in triplicate. Results were considered significant when *P < 0.05.

