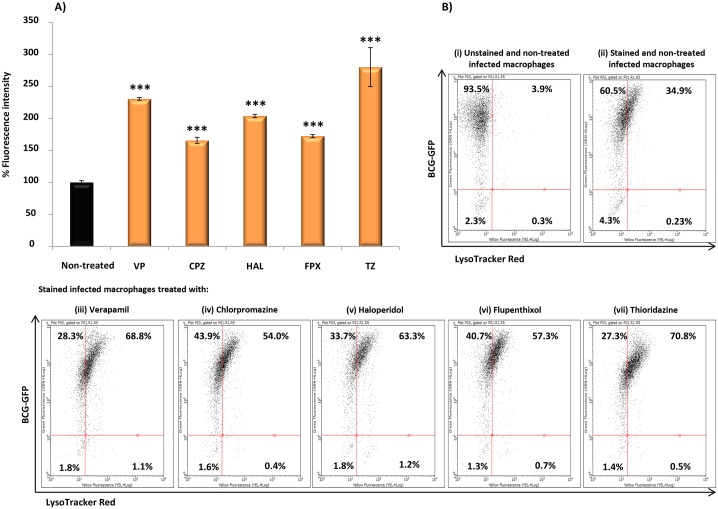
Fig 6. Relative quantification of phagosomal acidification in M. bovis BCG-GFP-infected macrophages stained with LysoTracker Red and analysed by flow cytometry.
Human macrophages were infected with M. bovis BCG-GFP, treated with verapamil (VP), thioridazine (TZ), chlorpromazine (CPZ), flupenthixol (FPX), and haloperidol (HAL). Data was analysed by flow cytometry using an easyCyte™ 5HT flow cytometer. A) Bars graph: quantification of the increase on the overall number of LysoTracker Red stained vesicles per cell (average fluorescence intensity); B) cytograms for (i), unstained and non-treated infected macrophages; (ii), stained and non-treated infected macrophages; and (iii) to (vii), stained and infected macrophages treated with VP, TZ, CPZ, FPX and HAL. VP was tested at 10 μg/ml; TZ at 2.5 μg/ml; CPZ, HAL and FPX at 1.25 μg/ml. Significance of the results was tested using Student’s t-test and were considered highly significant, ***P <0.001.

