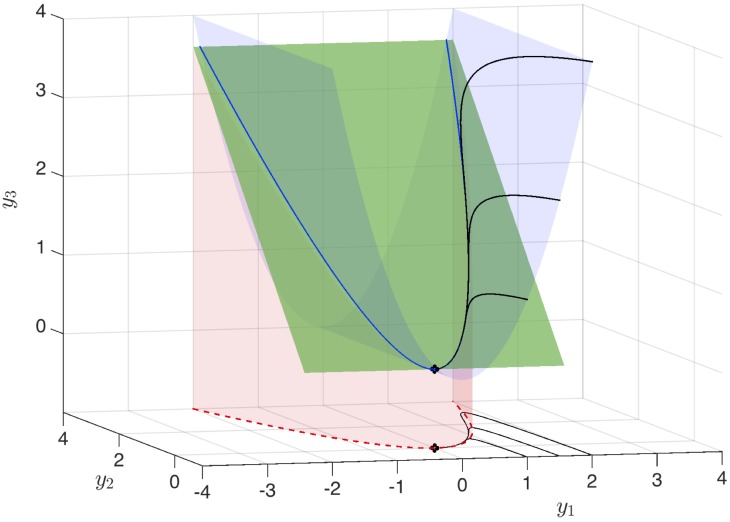
Fig 3. Visualization of three-dimensional linear Koopman system from Eq (25) along with projection of dynamics onto the x1-x2 plane.
The attracting slow manifold is shown in red, the constraint is shown in blue, and the slow unstable subspace of Eq (25) is shown in green. Black trajectories of the linear Koopman system in y project onto trajectories of the full nonlinear system in x in the y1-y2 plane. Here, μ = −0.05 and λ = 1. Figure is reproduced with Code 1 in S1 Appendix.

