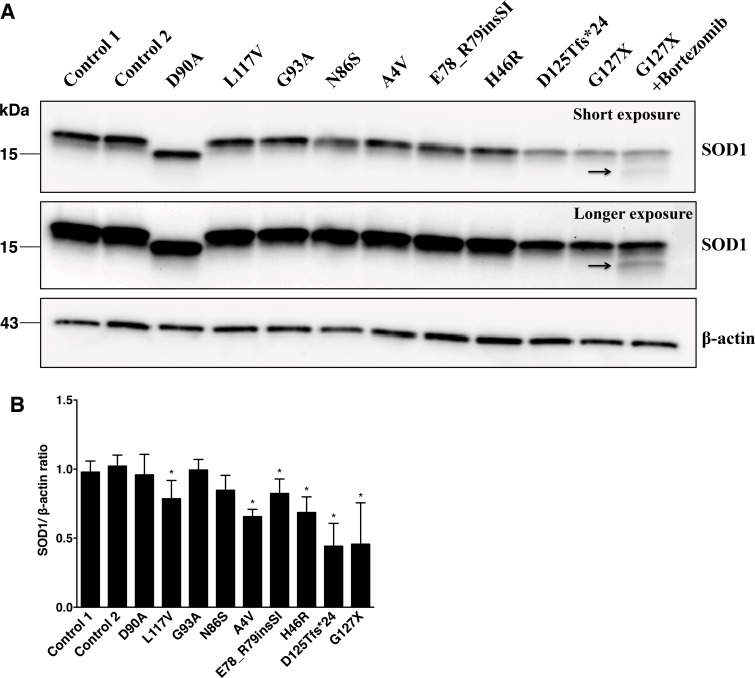
Fig 1. SOD1 protein in lysates of fibroblast cultures.
(A) Fibroblast lysates were analysed by western blotting using the anti-SOD1 (57–72 aa) antibody. β-actin was used as a loading control. The band of the truncated G127X mutant was not visible except in the presence of the proteasome inhibitor bortezomib (arrow). The homozygous D90A mutant displays increased mobility. (B) The expression of SOD1 in the fibroblast lines were compared as SOD1/β-actin ratios. The mean of the 2 control lines was taken as 1. Three replicate sets of fibroblast cultures were analyzed. The data are expressed as means ± SD. (*) p < 0.05 compared to the results for the controls (Mann-Whitney U test).

