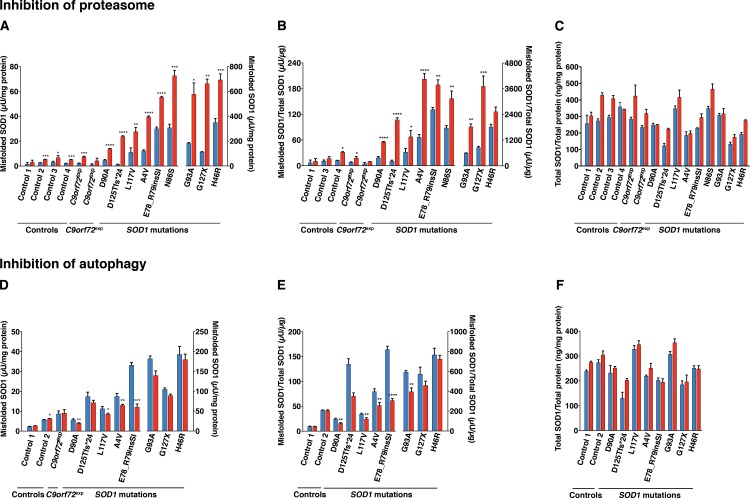
Fig 2. Effect of reduction in the activities of the proteasome and autophagy on the levels of misfolded and total SOD1 in fibroblast lines.
Misfolded and total SOD1 in lysates of fibroblasts were analysed with the 24–39 misELISA and ELISA for total SOD1, respectively. Fibroblast cell lines were cultured in triplicate for 24 h in the absence (blue) or the presence (red) of the proteasome inhibitor bortezomib (A-C; 5 ng/ml), the autophagy inhibitor 3-MA (D-F; 10 mM). Data is expressed as the mean ± SD (n = 3), *p< 0.05, **p< 0.01, ***p< 0.001, ****p< 0.0001 compared to respective non-treated control (Welch test and two-tailed unpaired t-test).

