Figure 1. Publication and citation productivity in relation to percentile score.
(A) The number of publications acknowledging support from grants within five years of grant approval (from PubMed) versus the percentile score: the bar shows the mean number of publications for all grants with that percentile score. (B) The number of citations that the papers in (A) received until the end of 2013 (data from Web of Science) versus the percentile score: the bar shows the mean number of citations for all grants with that percentile score. The lowest percentile scores are the most favorable. n = 102,740. Error bars = SDM. *Pink bars indicate significantly different from all cohorts of grants receiving poorer scores by one-way ANOVA. Black and gray bars do not differ significantly from their neighbors and are shown in different shades to allow easier visualization.

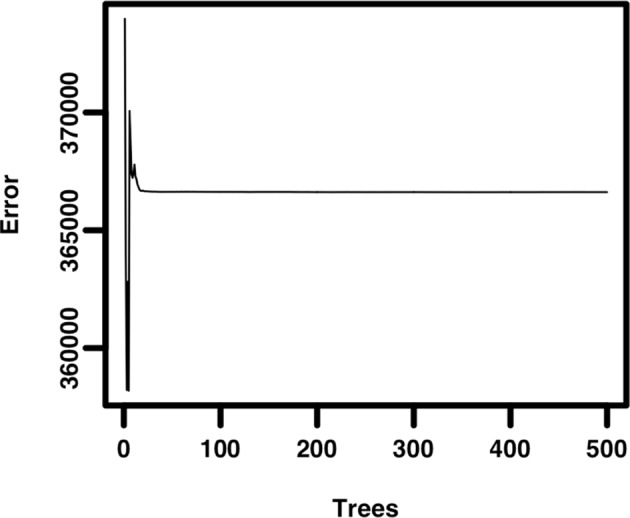
Figure 1—figure supplement 1. Random forest model of grant percentile score as a predictor of citation productivity.