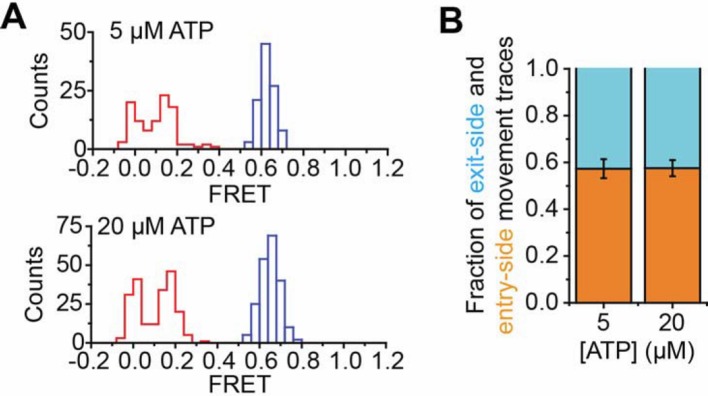
Author response image 1. Comparison of remodeling at 5 and 20 µM ATP.
(A) Histogram showing the distribution of FRET values before (blue) and after (red) addition of 1 nM RSC and 5 µM ATP (top) or 1 nM RSC and 20 µM ATP (bottom). The data in the bottom panel are reproduced from Figure 1E for comparison. (B) The fraction of exit-side movement (cyan) and entry-side movement (orange) traces observed with 1 nM RSC and the indicated concentration of ATP on H2A/[end, +6] nucleosomes. Error bars represent the standard error from >100 nucleosomes per construct. The data for the 20 µM ATP condition are reproduced from Figure 1D for comparison.

