. 2016 Feb 17;5:e11324. doi: 10.7554/eLife.11324

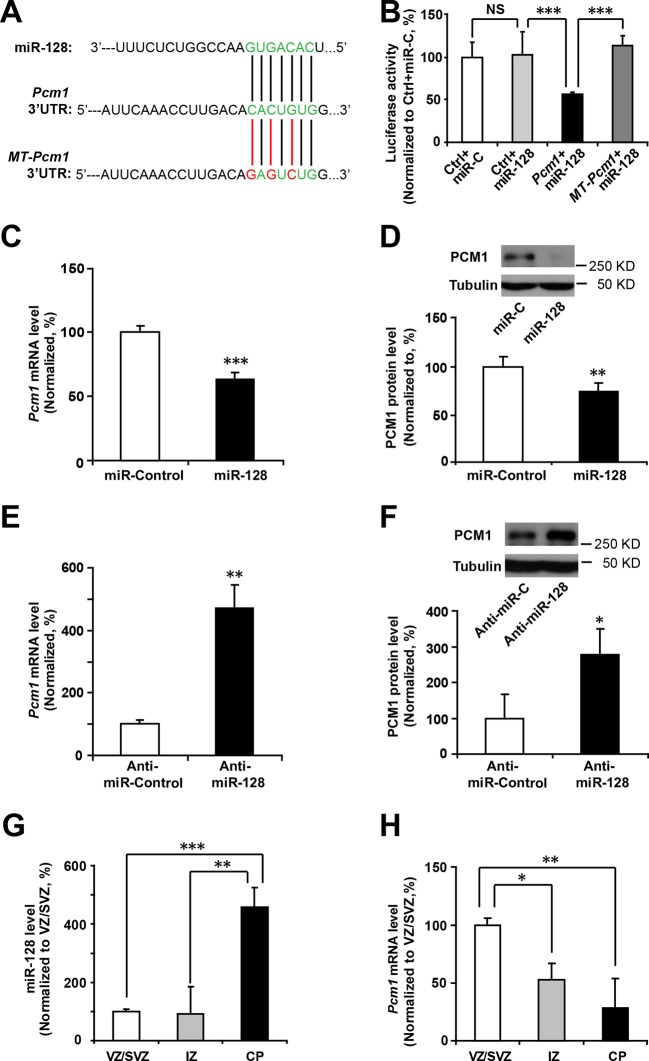
Figure 4. miR-128 regulates PCM1 expression in NPCs.

(A) TargetScan analysis identified a miR-128 target site in the mouse Pcm1 3’-UTR region (highlighted in green). The mutant PCM1 is shown, with the seed binding sites highlighted in red. (B) PCM1 luciferase activity is suppressed by miR-128. HEK293T cells were co-transfected with miR-128 and the 3’-UTR of Pcm1 containing either the miRNA binding site (WT) or mutant (MT) versions of the Pcm1 seed binding sites for 2 days. The cells were harvested and lysed, and a luciferase activity assay was then performed. miR-128-mediated suppression of PCM1 luciferase activity was relieved upon mutation of the Pcm1 seed binding sites. (C,D) miR-128 overexpression in NPCs led to reduced endogenous Pcm1 mRNA levels, as determined by qPCR (C), and PCM1 protein expression, as demonstrated via densitometry analysis of western blots (D). (E,F) anti-miR-128 leads to increased endogenous Pcm1 mRNA levels, as demonstrated by qPCR (E), and protein expression of PCM1 (F). (G,H) LCM was used to isolate RNA from three specific cortical layers of E14.5 embryonic brains: the VZ/SVZ, IZ, and CP. qPCR quantification of miR-128 levels (G) and Pcm1 mRNA levels (H). At least three sets of independent experiments were performed. The values represent the mean ± s.d. (n = 3). Student’s t-test, differences were considered significant at ***p<0.001, **p<0.01, and *p<0.05 for all panels in the figure. ANOVA, differences were considered significant at ***p<0.001 and **p<0.01.

DOI: http://dx.doi.org/10.7554/eLife.11324.016

Figure 4—source data 1. Gene Ontology (GO) of the miR-128 target gene list.
53 genes with annotated GO terms which were predicted as targets of miR-128 by both TargetScan and miRanda algorithms, were listed. The genes were sorted in alphabetical order. GO information was obtained from the PANTHER website (http://www.pantherdb.org).
DOI: 10.7554/eLife.11324.017
Figure 4—source data 2. Relative expression of 53 predicted miR-128 targets upon overexpression of miR-128 in NPCs.
Cultured NPCs were transfected with either miR-128 or miR-mimic control for 48 hr and were harvested for qPCR analysis. 11 genes (Pcm1, Lmbr1l, Foxo4, Sh2d3c, Nfia, Pde8b, Sec24a, Pde3a, Fbxl20, Ypel3 and Kcnk10) showed consistent and significant reduction in mRNA levels upon miR-128 expression in NPCs (highlighted in yellow). At least three sets of independent experiments were performed. The values represent the mean ± s.d. (n = 3).
DOI: 10.7554/eLife.11324.018
Figure 4—source data 3. Relative expression of miR-128 targets upon downregulation of miR-128 in NPCs using miR-Zip-128.
NPC primary cultures were transfected with either miR-Zip-128 or miR-Zip scramble control, and mRNAs of 11 target genes were measured via qPCR analysis. Only PCM1 was significantly upregulated upon anti-miR-128 expression in NPCs. At least three sets of independent experiments were performed. The values represent the mean ± s.d. (n = 3).
DOI: 10.7554/eLife.11324.019
Figure 4—source data 4. List of qPCR primers.
DOI: 10.7554/eLife.11324.020

Figure 4.

Figure 4—figure supplement 1. Schematic diagram outlines rationale of gene selection process.
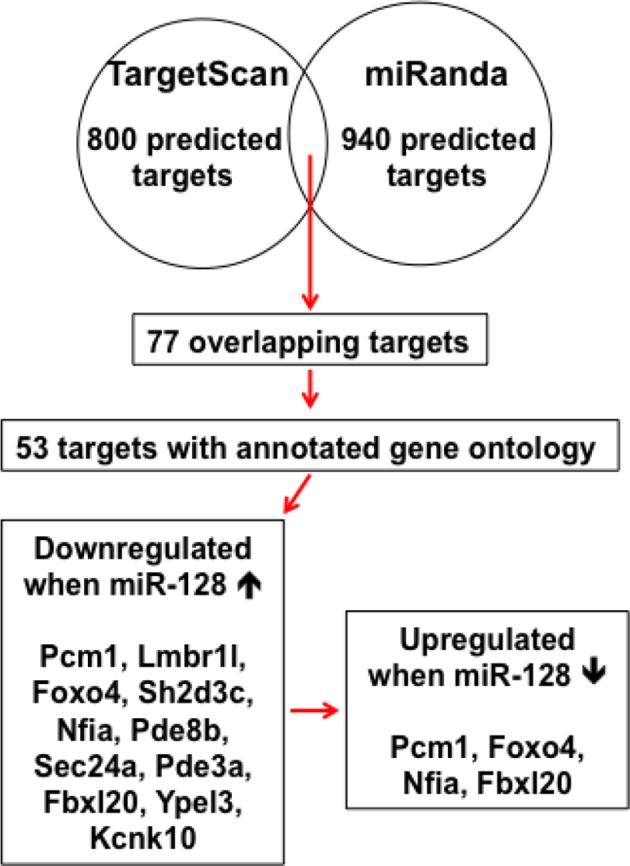
Figure 4—figure supplement 1.

Two widely used in silico microRNA target prediction databases (TargetScan and miRanda) predicted 800 and 940 potential targets of miR-128 respectively. Among the 77 overlapping targets only 53 were annotated to have known biological function and only 11 out of the 53 genes exhibited consistent reduction in mRNA levels upon miR-128 overexpression in cultured mouse NPCs and were further tested for reciprocal upregulation when miR-128 was inhibited. Lastly, upon miR-128 inhibition in NPCs, only Pcm1, Nfia, Foxo4, and Fbxl20 were consistently upregulated.
Figure 4—figure supplement 2. miR-128 inhibitor knockdown efficiency.
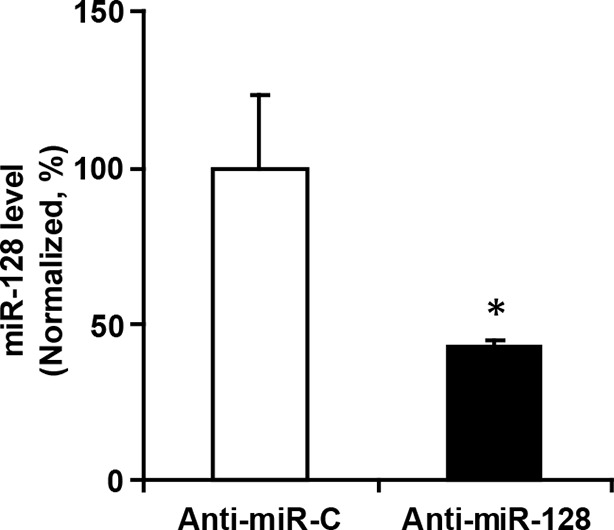
Figure 4—figure supplement 2.

qPCR quantification of miR-128 levels in NPCs following transfection with 2 µg miR-128 inhibitor (anti-miR-128) compared to the scramble control (anti-miR-control). The values represent the mean ± s.d. (n = 3). Student’s t-test, differences were considered significant at *p<0.05.
Figure 4—figure supplement 3. Inverse relationship between the temporal expression patterns of miR-128 and PCM1.
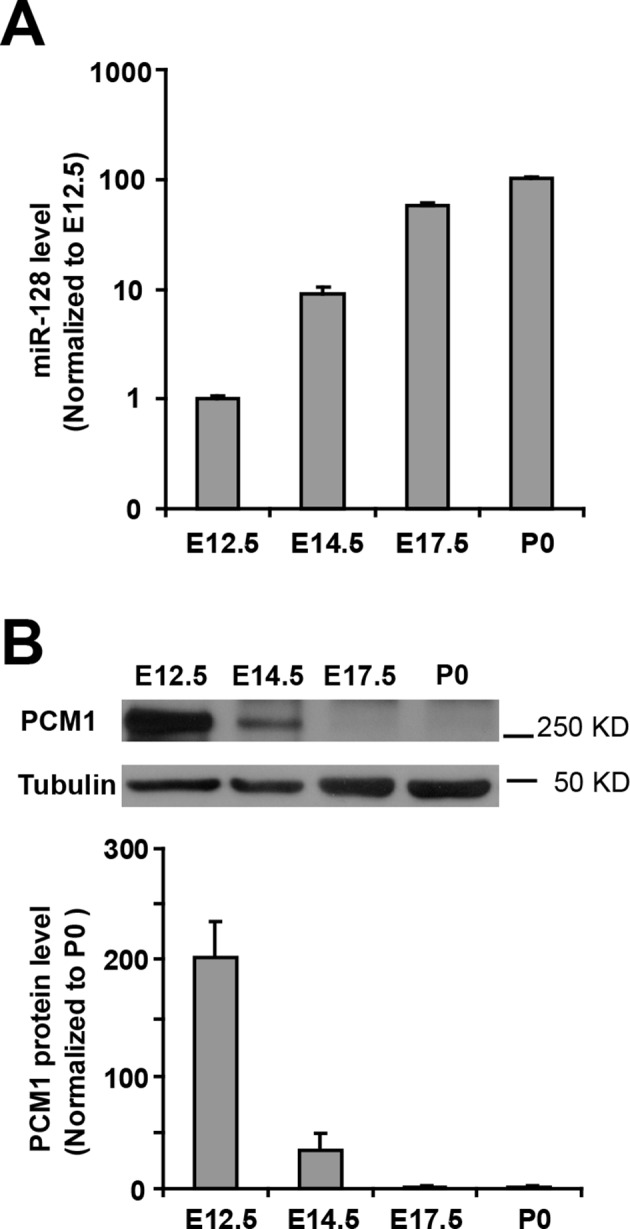
Figure 4—figure supplement 3.

(A) Real-time PCR analyses of miR-128 from brain tissues at various developmental stages. miR-128 expression was measured and normalized to that of U6 and is shown relative to the E12.5 expression level. The values represent the mean ± s.d. (n = 3). (B) Western blot of PCM1 expression in brain lysates prepared at various developmental stages with densitometry analysis. The values represent the mean ± s.d. (n = 3). Student’s t-test, differences were considered significant at *p<0.05.