. 2016 Feb 17;5:e11324. doi: 10.7554/eLife.11324

Figure 5. PCM1 knockdown decreases NPC neurogenesis.

(A,B) PCM1 knockdown in NPCs decreases neural proliferation. NPCs were electroporated with a plasmid expressing PCM1 shRNA or with a control vector and pulse-labeled with BrdU for 6 hr. NPCs were immunostained with an antibody against BrdU. The arrowheads indicate BrdU and GFP double-positive cells. Scale bars, 10 µm. Quantification of the number of GFP-BrdU double-positive cells relative to the total number of GFP-positive cells (B). (C,D) PCM1 knockdown in NPCs increases neurogenesis. NPCs were electroporated with a plasmid expressing PCM1 shRNA or with a control vector and then immunostained with antibodies against TUJ1. The arrowheads indicate TUJ1+GFP+ cells. Scale bars, 50 µm. Quantification of the number of GFP-TUJ1 double-positive cells relative to the number of GFP-positive cells (D). More than 1500 GFP-positive cells were counted for each condition. At least three sets of independent experiments were performed. The values represent the mean ± s.d. (n = 3). Student’s t-test, differences were considered significant at ***p<0.001.

DOI: http://dx.doi.org/10.7554/eLife.11324.024

Figure 5.

Figure 5—figure supplement 1. Efficient knockdown of PCM1.

Figure 5—figure supplement 1.

(A) PCM1 knockdown in N2A cells demonstrated by western blots. (B) Densitometry analysis of western blots presented in (A). PCM1 shRNA2 was used for further proliferation and neurogenesis analysis in NPCs. At least three sets of independent experiments were performed. The values represent the mean ± s.d. (n = 3). Student’s t-test, differences were considered significant at **p<0.01.
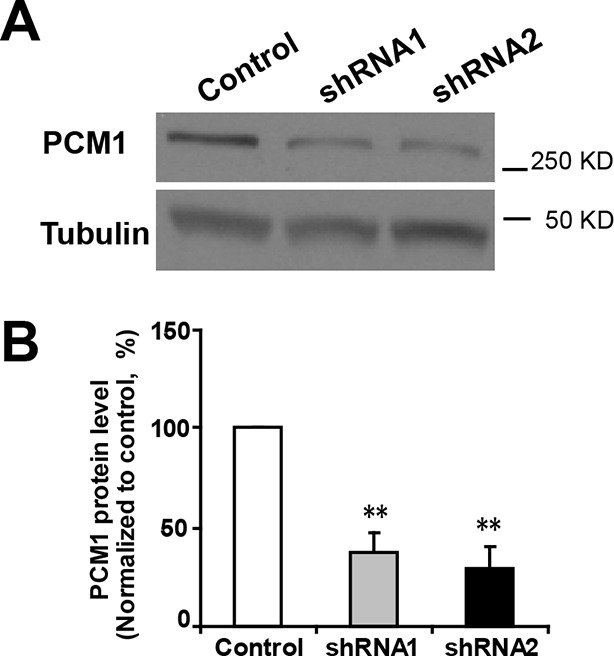
Figure 5—figure supplement 2. PCM1 knockdown in NPCs did not trigger apoptotic cell death.

Figure 5—figure supplement 2.

(A,B) Ectopic expression of PCM1 shRNA does not affect TUNEL staining. Quantification of the number of GFP-TUNEL double-positive cells relative to the total number of GFP-positive cells (B). (C,D) Ectopic expression of PCM1 shRNA does not affect cleaved caspase-3 (C-caspase 3) staining. Scale bars, 20 μm. Quantification of the number of GFP-C-caspase 3 double-positive cells relative to the total number of GFP-positive cells (D). More than 1500 GFP-positive cells were counted for each condition. At least three sets of independent experiments were performed. The values represent the mean ± s.d. (n = 3). Student’s t-test, differences were considered significant at *p<0.05.
Figure 5—figure supplement 3. PCM1 knockdown in NPCs increases neurogenesis.

Figure 5—figure supplement 3.

(A-,B) NPCs were electroporated with a plasmid expressing PCM1 shRNA or with a control vector and then immunostained with antibodies against MAP2. The arrowheads indicate MAP2+GFP+ cells. Scale bars, 50 µm. Quantification of the number of GFP-MAP2 double-positive cells relative to the number of GFP-positive cells (B). More than 1500 GFP-positive cells were counted for each condition. At least three sets of independent experiments were performed. The values represent the mean ± s.d. (n = 3). Student’s t-test, differences were considered significant at ***p<0.001.
Figure 5—figure supplement 4. Overexpression of PCM1 increases NPC proliferation.

Figure 5—figure supplement 4.

(A,B) Overexpression of PCM1 increases NPC proliferation. NPCs were electroporated with a PCM1 overexpression construct or a control vector and pulse-labeled with BrdU for 6 hr. NPCs were immunostained with an antibody against BrdU. The arrowheads indicate BrdU and GFP double-positive cells. Scale bars, 10 µm. Quantification of the number of GFP-BrdU double-positive cells relative to the total number of GFP-positive cells (B). More than 1500 GFP-positive cells were counted for each condition. At least three sets of independent experiments were performed. The values represent the mean ± s.d. (n = 3). Student’s t-test, differences were considered significant at ***p<0.001.
Figure 5—figure supplement 5. Overexpression of PCM1 decreases NPC neuronal differentiation.

Figure 5—figure supplement 5.

(A,B) Ectopic expression of PCM1 decreases TUJ1 staining. NPCs were electroporated with a PCM1 overexpression construct or a control vector and immunostained with antibodies against TUJ1. The arrowheads indicate TUJ1+GFP+ cells. Scale bars, 50 µm. Quantification of the number of GFP-TUJ1 double-positive cells relative to the number of GFP-positive cells (B). (C,D) Ectopic expression of PCM1 decreases MAP2 staining. NPCs were electroporated with the indicated plasmids and immunostained with antibodies against MAP2. The arrowheads indicate MAP2+GFP+ cells. Scale bars, 50 µm. Quantification of the number of GFP-MAP2 double-positive cells relative to the number of GFP-positive cells (D). More than 1500 GFP-positive cells were counted for each condition. At least three sets of independent experiments were performed. The values represent the mean ± s.d. (n = 3). Student’s t-test, differences were considered significant at ***p<0.001.
Figure 5—figure supplement 6. Overexpression of PCM1 in NPCs did not trigger apoptotic cell death.

Figure 5—figure supplement 6.

(A,B) Ectopic overexpression of PCM1 does not affect TUNEL staining. Quantification of the number of GFP-TUNEL double-positive cells relative to the total number of GFP-positive cells (B). (C,D) Ectopic overexpression of PCM1 does not affect cleaved caspase-3 (C-caspase 3) staining. Scale bars, 20 μm. Quantification of the number of GFP-C-caspase 3 double-positive cells relative to the total number of GFP-positive cells (D). More than 1500 GFP-positive cells were counted for each condition. At least three sets of independent experiments were performed. The values represent the mean ± s.d. (n = 3). Student’s t-test, differences were considered significant at *p<0.05.
Figure 5—figure supplement 7. PCM1 regulates NPC proliferation and differentiation in vivo.

Figure 5—figure supplement 7.

(A,B) PCM1 regulates the symmetric division of apical progenitors in the VZ/SVZ. Mouse embryos were electroporated at E13.5 with the indicated plasmids and sacrificed at E14.5. The nuclei of mitotic cells were labeled using antibodies against PH3. The orientation of the mitotic spindle relative to the ventricular surface was determined and categorized into horizontal (0–30°), oblique (30–60°), or vertical (60–90°) as pictured. Scale bars, 5 µm (A). Percentage of GFP and PH3 double-positive cells with the indicated mitotic spindle orientation following PCM1 overexpression (B). (C,D) Overexpression of PCM1 increases NPC proliferation in vivo compared to vector-only control treatment. Mouse embryos were electroporated at E13.5 with the indicated constructs. Twenty-four hours post-electroporation, dividing cells were marked by EdU pulse-labeling for 2 hr and sacrificed. The arrowheads indicate EdU+GFP+ cells. Scale bars, 10 µm. Quantification of the number of GFP-EdU double-positive cells relative to the number of GFP-positive cells (D). (E,F) Overexpression of PCM1 increases apical progenitors compared to vector-only control treatment. Mouse embryos were electroporated at E13.5 with the indicated constructs and sacrificed at E14.5. Brain sections were immunostained with antibodies against PAX6. The arrowheads indicate PAX6+GFP+ cells. Scale bars, 10 µm. Quantification of the number of GFP-PAX6 double-positive cells relative to the number of GFP-positive cells (F). (G,H) Overexpression of PCM1 decreases the number of basal progenitors compared to vector-only control treatment. Mouse embryos were electroporated at E13.5 with the indicated constructs and sacrificed at E14.5. Brain sections were immunostained with antibodies against TBR2. The arrowheads indicate TBR2+GFP+ cells. Scale bars, 10 µm. Quantification of the number of GFP-TBR2 double-positive cells relative to the number of GFP-positive cells (H). (I,J) Overexpression of PCM1 decreases neurogenesis compared to vector-only control treatment. Mouse embryos were electroporated at E13.5 with the indicated constructs and sacrificed at E17.5. Brain slices were immunostained for NEUN. Arrowheads indicate NEUN+GFP+ cells. Scale bars, 10 µm. Quantification of the number of GFP-NEUN double-positive cells relative to the number of GFP-positive cells (J). More than 1500 GFP-positive cells were counted for each condition. At least three sets of independent experiments were performed. The values represent the mean ± s.d. (n = 3). Student’s t-test, differences were considered significant at ***p<0.001.