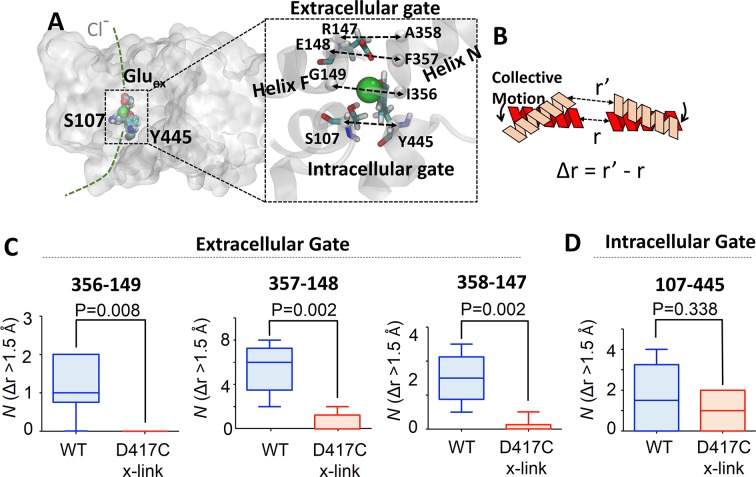
Figure 8. Coupling of extracellular and intracellular gating motions to collective motions in ClC-ec1 detected computationally.
(A) Key inter-Cα distances were employed to detect functional motions. The left panel shows the location of the Cl- gates (dashed box) and transport pathways (dashed green line) in ClC-ec1. Right panel shows a close-up of the Cl- gates where key inter-Cα distances for both the extracellular and intracellular gates are denoted by dashed double arrows. (B) Scheme for determining distance change (Δr) caused by a collective motion. Following a collective motion, a native structure (red helices) undergoes structural transition (peach helices). As a result, the distance between the helices increases by Δr = r’ – r. (C) Opening motions of the extracellular gate. The number (N) of collective motions that lead to distance changes (Δr > 1.5 Å) at each of the extracellular-gate residue pairs was determined from analysis of MD simulations for WT and cross-linked (“D417C x-link”) ClC-ec1, as described in the text. The data are shown in a box-and-whisker plot where the whiskers denote minimum and maximum of the data and the box denotes the range of 25th percentile to 75th percentile of the data when sorted. The horizontal line in the box denotes the median of the data. (D) The number (N) of collective motions that lead to distance changes (Δr > 1.5 Å) at the intracellular gate pair 107–445 is not significantly different between WT and cross-linked ClC-ec1.

