. 2016 Jan 29;5:e12813. doi: 10.7554/eLife.12813

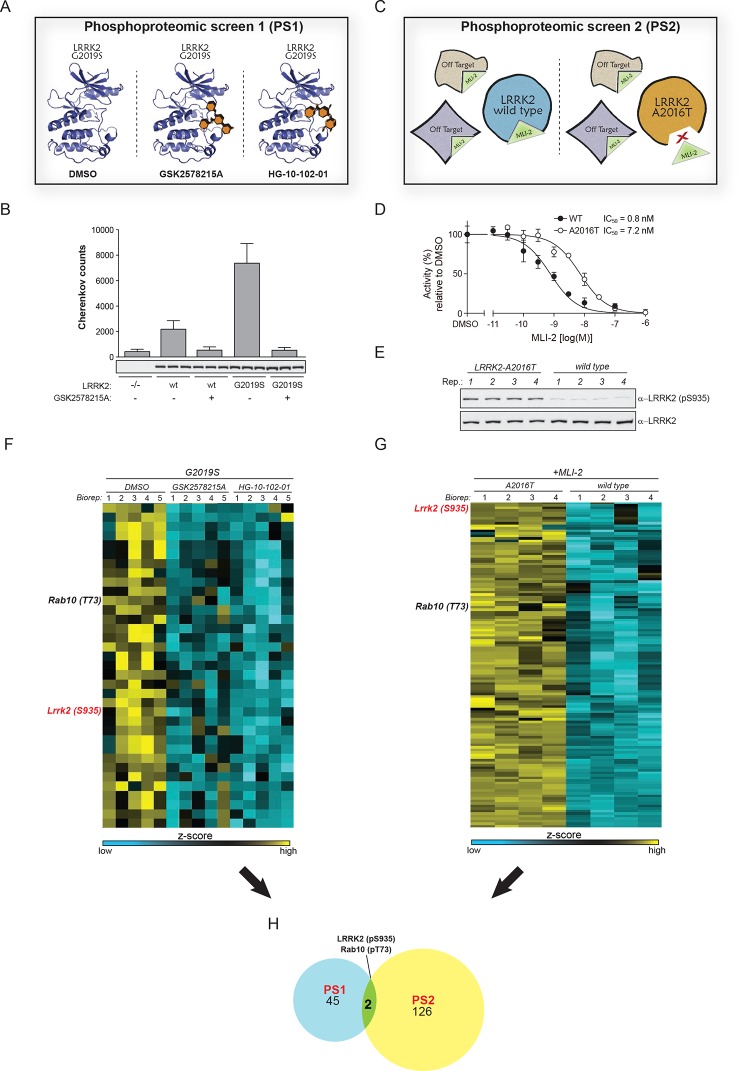
Figure 1. Two unbiased phosphoproteomic screens identify physiological LRRK2 targets.

(A) Experimental setup of PS1. LRRK2-G2019SGSK mouse embryonic fibroblasts (MEFs, n=5) were treated with DMSO or each of two structurally distinct LRRK2 inhibitors GSK2578215A or HG-10-102-01 (1 µM for 90 min). (B) LRRK2 immunoprecipitated from either knockout (-/-), wild-type (wt) or LRRK2-G2019SGSK (G2019S) knock-in MEFs was assessed for phosphorylation of Nictide (Nichols et al., 2009) peptide substrate in absence or presence of GSK2578215A (2 μM). Western blot below shows that similar levels of LRRK2 were immunoprecipitated. Error bars are mean ± SD (n=3). (C) Scheme of PS2. The higher affinity of MLI-2 toward wt-LRRK2 allows specific pinpointing of LRRK2 substrates when comparing the phosphoproteomes of wt and A2016T MEFs. (D) Kinase activities of wt (closed circles) and A2016T (open circles) GST-LRRK2 [1326-2527] purified from HEK293 cells were assayed in the presence of the indicated concentration of MLI-2 (n=3). (E) Decreased levels of pS935-LRRK2 in wt MEFs after treatment with 10 nM MLI-2. (F) Heat map cluster of phosphopeptides in PS1 (p<0.005) which are downregulated after treatment with both GSK2578215A and HG-10-102-01. (G) Heat map cluster of downregulated (FDR=0.01, S0=0.2) phosphopeptides in PS2. (H) Venn diagram of overlapping downregulated phosphosites in PS1 and PS2. (Biorep= biological replicate). SD, standard deviation.

DOI: http://dx.doi.org/10.7554/eLife.12813.003

Figure 1.

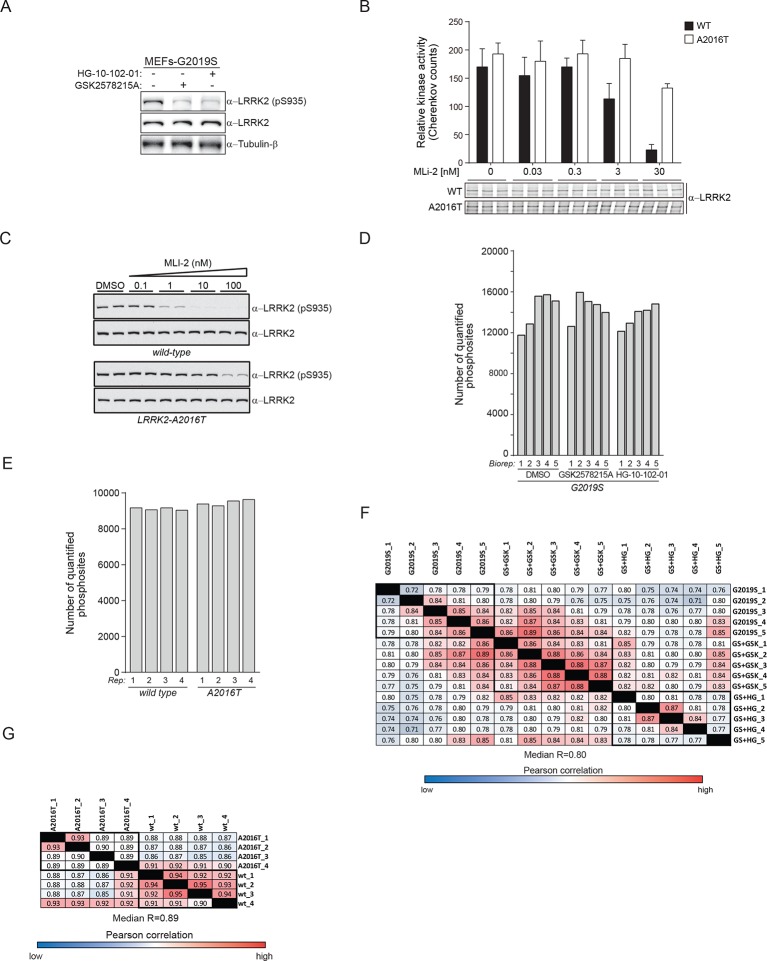
Figure 1—figure supplement 1. Two unbiased phosphoproteomic screens identify physiological LRRK2 targets.

Figure 1—figure supplement 1.

(A) Western blot analysis of wild type (wt) and LRRK2-G2019SGSK (G2019S) mouse embryonic fibroblasts (MEFs), treated with DMSO (-) or 1 µM of GSK2578215A or HG-10-102-01 for 90 min. (B) In vitro kinase assay using LRRK2 immunoprecipitated from MEFs (wt and A2016T) in the presence of various concentrations of MLi-2. Phosphorylation of Nictide was quantified by liquid scintillation counting. The western blot below shows that similar levels of LRRK2 were used. Error bars are mean ± SD (n=3). (C) Western blot analysis of pS935-LRRK2 and total LRRK2 levels in wt-LRRK2 MEFs and A2016T-LRRK2 MEFs treated for 60 min with the indicated concentrations of MLI-2. (D) Number of quantified class I phosphorylation sites of PS1 in five biological replicates (Biorep) per phenotype analyzed. (E) More than 9000 phosphorylation sites are identified in each of the four biological replicates (Biorep) of wild type and A2016T MEFs (PS2). (F) Pearson correlations for the phosphoproteomes of PS1 and PS2 (G). SD, standard deviation.
Figure 1—figure supplement 2. Two unbiased phosphoproteomic screens identify physiological LRRK2 targets.

Figure 1—figure supplement 2.

(A) Venn diagram of significantly regulated (ANOVA, p<0.005) sites with GSK2578215A and HG-10-102-01 in PS1. (B) Heat map of regulated phosphosites identified in five biological replicates of MEFs (LRRK2-G2019SGSK (DMSO), LRRK2-G2019SGSK+ GSK2578215A. and LRRK2-G2019SGSK + HG-10-102-01). (C) Clusters identified in (B). (D) Volcano plot of all phosphosites of PS2. Significant sites are in blue and pS935 is indicated. ANOVA, analysis of variance.