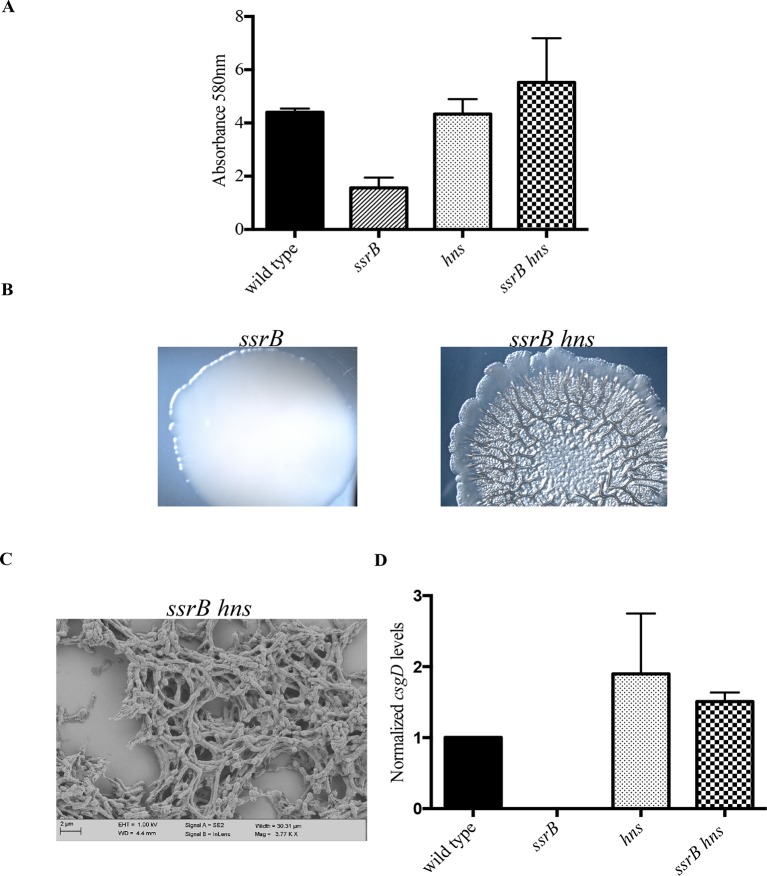
Figure 4. hns deletion rescues biofilm formation in the ssrB mutant as shown by Crystal violet staining.
(A) The amount of biofilms formed is higher in the wild type, hns and ssrB hns strains compared to the ssrB null, n = 3, Mean ± SD, p < 0.0001. Source data file: Figure 4—source data 1. Macrocolony phenotype (B) ssrB hns forms a highly rugose and dry macrocolony, while the ssrB macrocolony was smooth and mucoidy. SEM imaging (C) ssrB hns biofilms were covered by a thick extra-cellular matrix; scale bar = 2 µm. (D) qRT-PCR: csgD levels were restored in the ssrB hns strain and were higher than the wild type (p < 0.03) and the ssrB mutant (p < 0.003) against rrsA transcripts as a control. Note that the normalized csgD levels in the ssrB null were 0.0009, too low for the scale. n = 2, Mean ± SD. Source data file: Source data file: Figure 4—source data 2.
DOI: http://dx.doi.org/10.7554/eLife.10747.017

