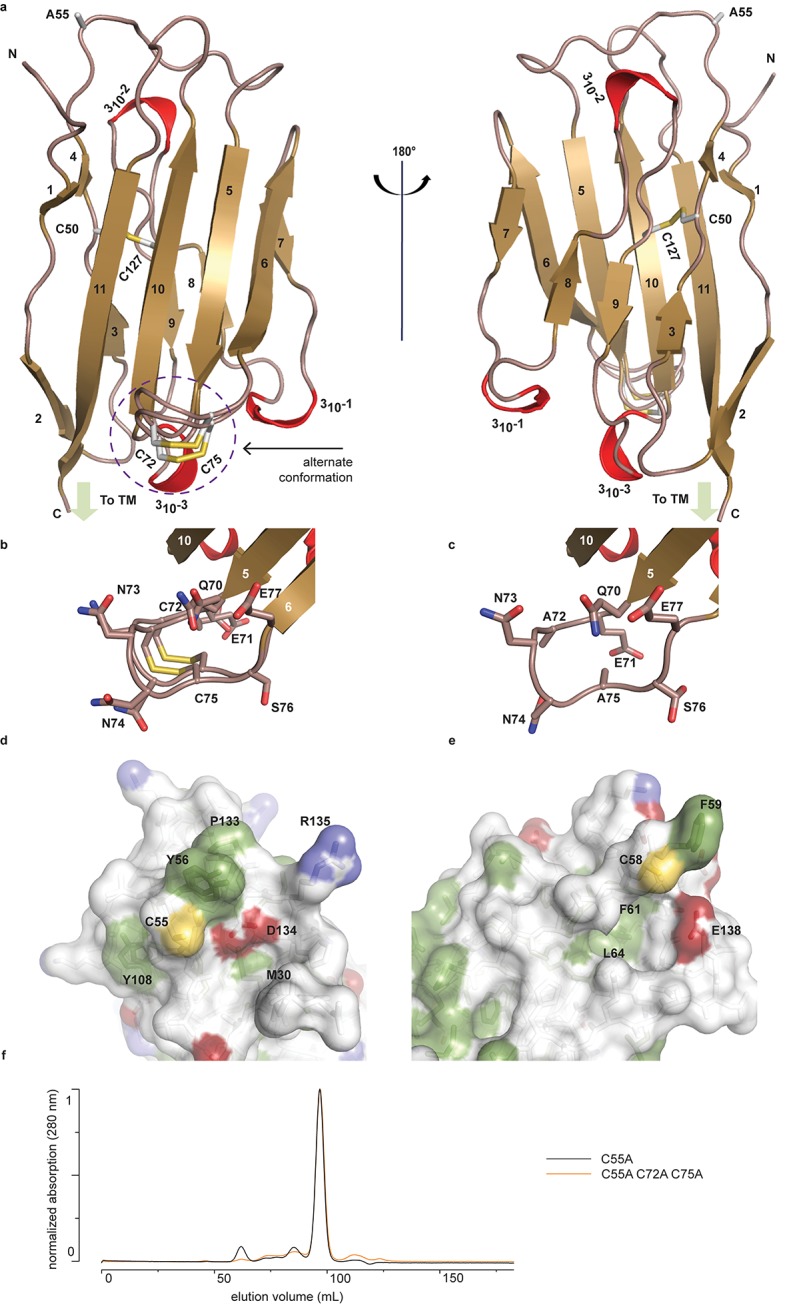
Figure 1. Crystal structure of hβ2.

(a) Cartoon representation of the hβ2 (C55A) extracellular domain crystal structure, showing β strands in gold and 310 helices in red. Cysteine side chains, as well as the 55Ala residue, are shown in stick representation. Positions of N-terminus (N) and C-terminus (C) are indicated. The loop containing the 72Cys- 75Cys disulfide bond is modeled in a dual conformation. (b) Detail of the dual conformation of the loop, showing all side chains in stick conformation. (c) Detail of the same loop in the C72A/C75A (C55A) mutant, shown from the same viewpoint as in panel (b). (d,e) Comparison of the surfaces of hβ2 (d) and hβ4 (e) surrounding the reactive cysteines (55Cys and 58Cys, respectively). Side chains of hydrophobic residues are shown in green, negatively charged carboxyl groups in red, and positively charged amino and guanidinium groups in blue. The position of the cysteine (which has been mutated to alanine to allow crystallization) is shown in yellow. (f) Size exclusion chromatograms (Preparative Superdex200) for hβ2 C55A and hβ2 C55/72/75A, which both elute as monomeric species.
DOI: http://dx.doi.org/10.7554/eLife.10960.003
