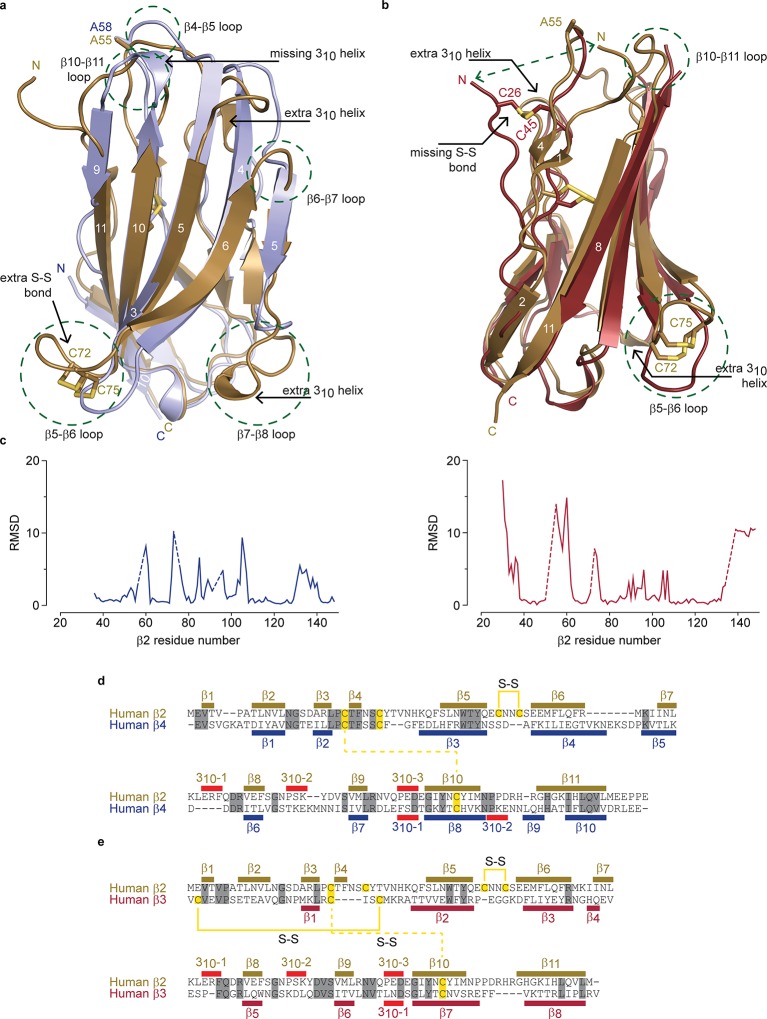
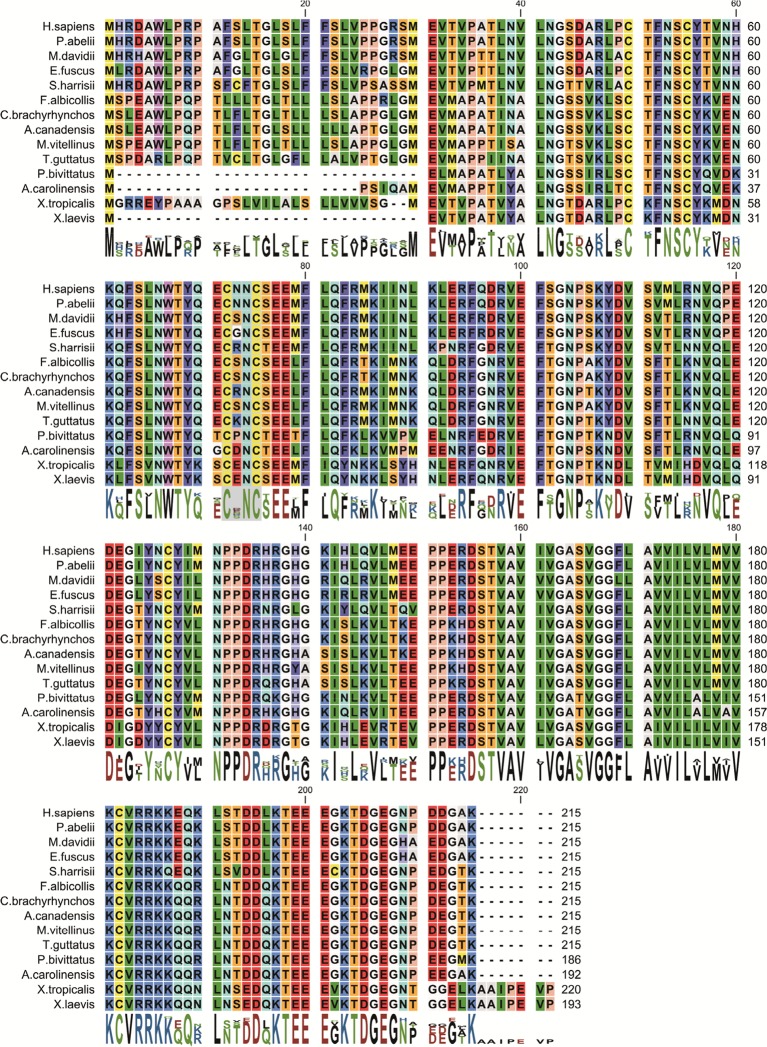
Figure 2. Structural comparison of hβ2 to hβ3 and hβ4.
(a) Superposition of the crystal structures of hβ2 C55A (gold) and hβ4 C58A (blue) in cartoon representation. Cysteines or their equivalent residues (A55 and A58, respectively) are shown in sticks. The major differences are highlighted in the figure. (b) Superposition of crystal structures of hβ2 C55A (gold) and hβ3 (red). (c) Root-mean-square-deviation (RMSD) plots showing the RMSD values per residue for hβ4 C58A (left, blue plot) and hβ3 (right, red plot) relative to hβ2 after a superposition. The residue numbers below correspond to the hβ2 numbers. Sections for which there are no corresponding residues at indicated with dotted lines. (d,e) Shown are sequence alignments of the extracellular domains of (d) hβ2 versus hβ4 and (e) hβ2 versus hβ3. Conserved residues are highlighted in grey, and cysteines in yellow. Observed disulfide bonds are also labeled (S-S). Secondary structure elements found in the corresponding crystal structures are also shown.


