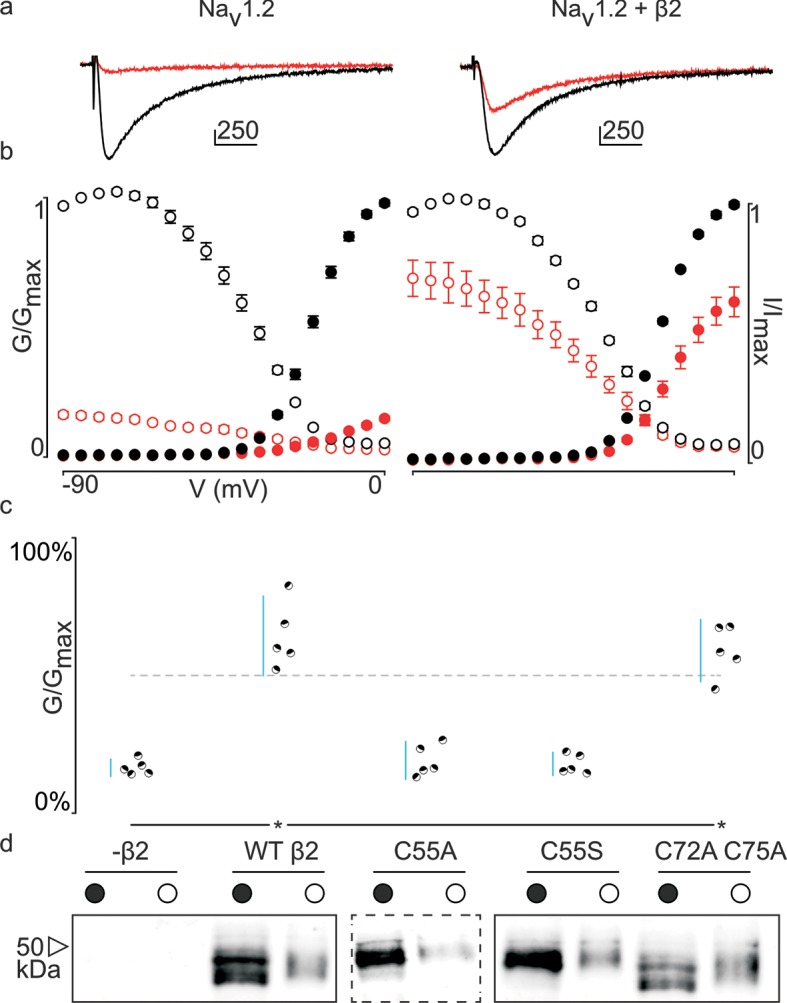
Figure 3. Effect of hβ2 on hNav1.2 toxin pharmacology.
(a) Co-expression of hNav1.2 with hβ2 decreases the degree of inhibition by 100 nM ProTx-II. Left trace shows ProTx-II strongly inhibiting WT hNav1.2 whereas right trace displays attenuated inhibition in the presence of hβ2. Black trace is control condition without toxin, red is in the presence of ProTx-II. Traces depict a 50 ms depolarization to -15 mV from -90 mV. Scale bar is 10 ms on horizontal axis and given nA vertically. (b) Normalized conductance-voltage (G-V, filled circles) and steady-state inactivation (I-V, open circles) relationships for hNav1.2 with and without hβ2. Pre-toxin values are shown in black and post-toxin in red. Fit values can be found in Figure 3—source data 1. (c) Dot plot comparing hβ2 mutations by ability to prevent ProTx-II inhibition of hNav1.2. Black circles represent individual oocytes; vertical axis shows percent of inhibition by ProTx-II at peak conductance. Blue lines represent a 95% confidence interval. hβ2 mutations are presented underneath the horizontal axis and label the lanes below in (d). Statistical significance (p<0.01) is indicated by an asterisk. (d) Western blot against the C-terminal myc-tag of hβ2. No signal is seen in the negative control but is observed for the WT hβ2 and all mutants, both in whole cell (filled circle) and surface (open circle) fractions.
DOI: http://dx.doi.org/10.7554/eLife.10960.007

Figure 3—figure supplement 1. ProTx-II does not bind directly to β4.

Figure 3—figure supplement 2. G-V and SSI relationships for hβ2 mutants.

