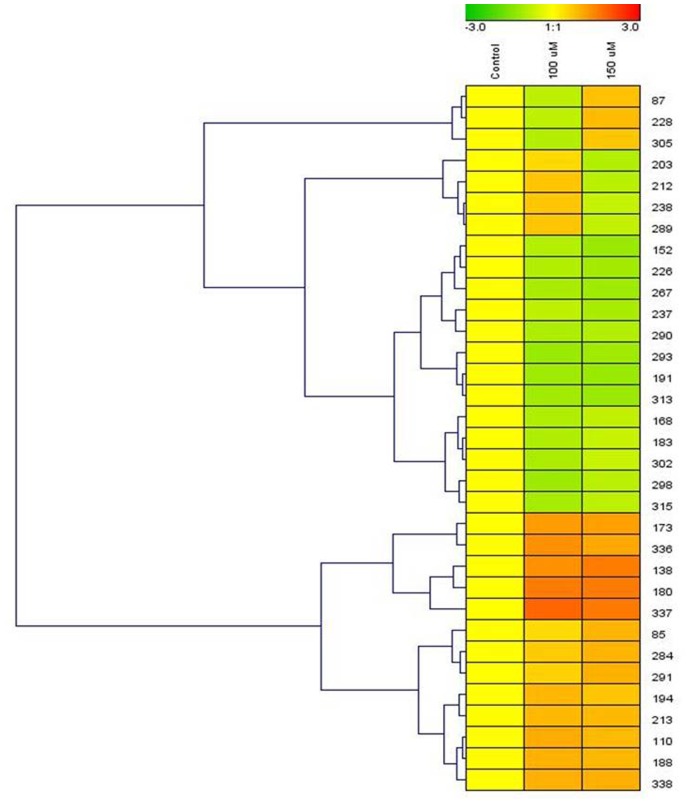
Fig 5. Cluster analysis of cadmium-responsive leaf proteins.
Ten-day-old sorghum seedlings were exposed to cadmium stress for 5 days. Samples from non-treated control plants and treated plants were collected on the same day. Differences in the intensity of labeling associated with the proteins in both the control and the cadmium-treated samples are shown as clusters. Any statistically significant difference (p < 0.05) in labeling intensity was considered to be positive. The protein spot numbers are indicated on the right side of the cluster. The clusters were determined using Genesis software (ver. 1.7.6).

