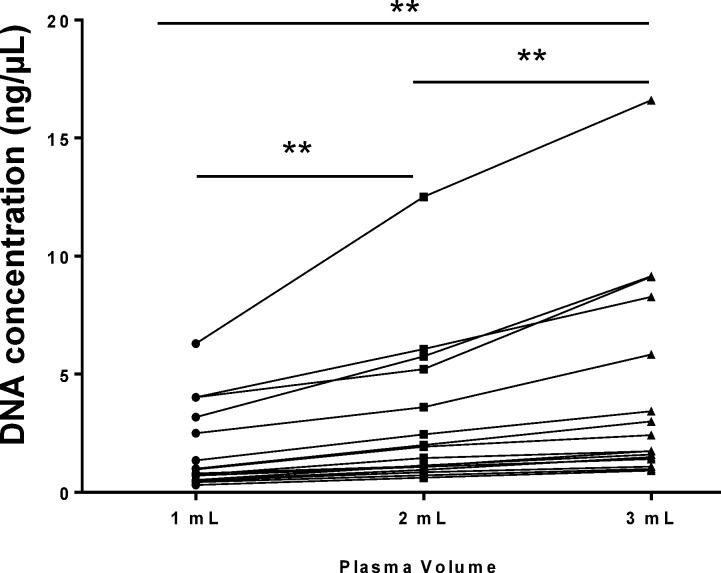
Fig 3. Plasma input volume comparison.
Three volumes of plasma (1 mL, 2 mL and 3 mL) were processed from each sample in a cohort of 15 NSCLC patients. DNA was extracted using the QIAamp CNA Kit and was measured by qPCR using the ABI TaqMan® RNase P Detection Reagent Kit. Results are displayed for each patient. Statistical analysis was performed using a paired Student’s t-test where; **p<0.01.

