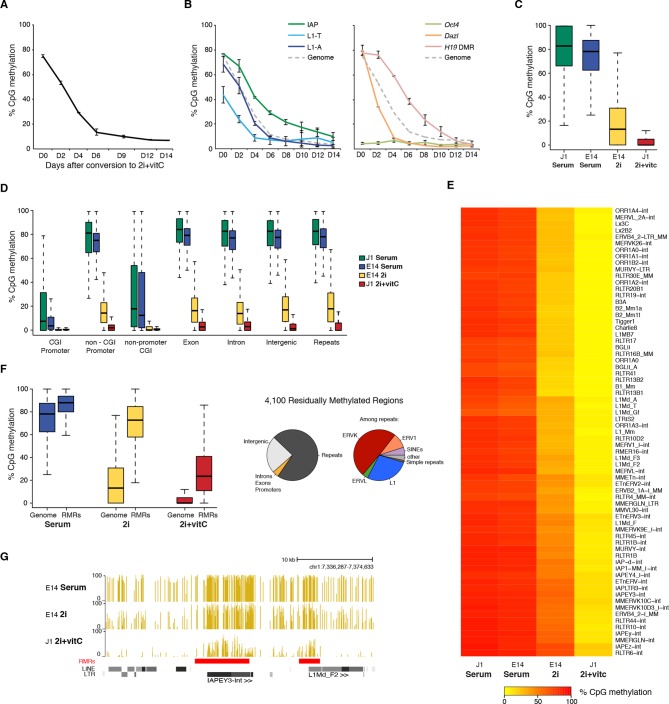
Figure 1. Kinetics and extent of DNA methylation loss in ES cells upon serum to 2i+vitC conversion.
(A) Time course of global CpG methylation loss measured by LUMA over 14 days (D0 to D14) of conversion from serum to 2i+vitC. Data represent mean and Standard Error of the Mean (SEM) between two biological replicates. (B) Sequence-specific CpG methylation level measured by bisulfite pyrosequencing. Data represent mean ± SEM between two biological replicates. (C) Tukey boxplot representation of genome-wide CpG methylation content as measured by WGBS in different culture conditions. Datasets of J1 Serum, E14 Serum and E14 2i were obtained from previous studies (Habibi et al., 2013; Seisenberger et al., 2012) (D) CpG methylation distribution over different genomic compartments by WGBS. (E) Heatmap and hierarchical clustering of average CpG methylation over 69 transposon families as measured by WGBS. (F) Left panel: Tukey boxplot representation of CpG methylation content in Residually Methylated Regions (RMRs) (n = 4,100) compared to the whole genome in various culture conditions. Right panel: pie chart distribution of 2i+vitC RMRs in different genomic compartments (left) and among repeats (right). (G) Example of WGBS profile of a genomic region containing two 2i+vitC RMRs mapping to an IAPEY and a L1 elements. Bars represent the methylation percentage of individual CpG sites, between 0 (unmethylated) and 100% (fully methylated). Location of LINE and LTR transposons (RepeatMasker) are displayed below; the RMRs are highlighted in red.


