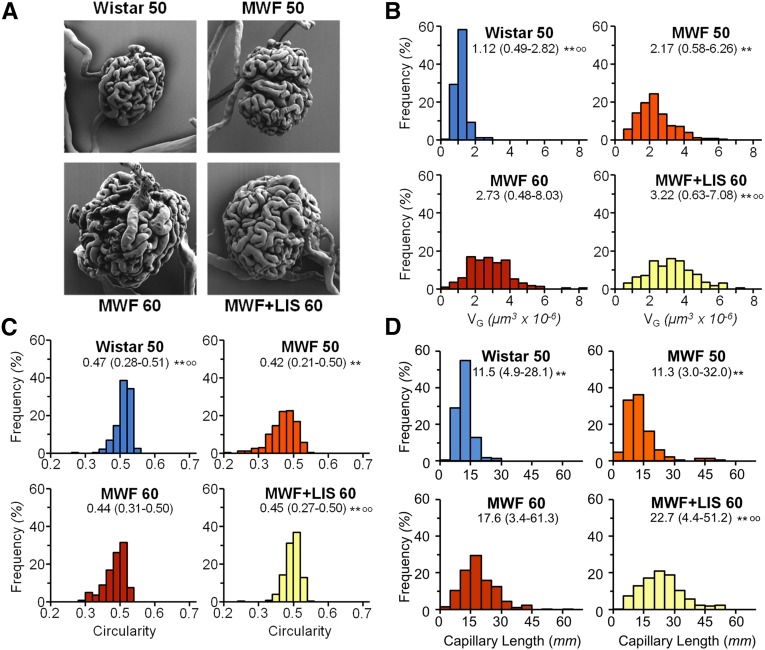
Figure 2.
ACE inhibition enhances GC volume and length. (A) Representative SEM images of GC lumen in Wistar and MWF rats. (B) VG distribution histograms in Wistar and MWF rats. (C) Distribution histogram of glomerular circularity. (D) Distribution histogram of estimated individual capillary length. Values are median (range; n=225 glomeruli per group). **P<0.01 versus MWF60; °°P<0.01 versus MWF50. LIS, lisinopril.

