Figure 4.
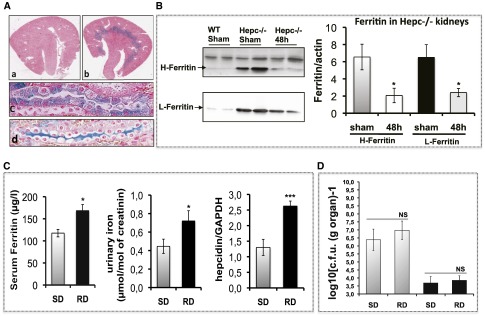
Iron content in the kidney. (A) Tissue iron content was determined by Perl’s staining of the kidney sections. The upper panel (a) and (b) are representative images of WT (a) and Hepc−/− (b) kidneys. Iron deposition was observed only in Hepc−/− kidneys, mostly in the medulla with a minor presence in the cortical region. At higher magnification (the two lower panels), iron was observed in thick ascending limb cells (c) and in the lumen of the collecting duct (d). (B) Protein expression of H-ferritin and L-ferritin in the kidney. WT and Hepc−/− mice were infected with 109 colony-forming units (CFUs) of CFT073, and the protein expression of H-ferritin and L-ferritin in the kidneys was determined by western blot at 48 hours postinfection. The amounts of both proteins were normalized to β-actin. (C) Iron parameters in mice fed with an iron-rich diet (RD) compared with control mice with standard died (SD), were evaluated by the measure of serum ferritin, urinary iron and hepatic level of hepcidin-mRNA. (D) SD and RD mice were infected with 109 CFUs of CFT073, and bacterial counts were performed on bladder and kidneys at 24 and 48 hours postinfection. (Sham) means uninfected mice. Gray bars are bacterial counts in the bladder, and black bars are bacterial counts in the kidneys. The results are the mean±SEM of at least six individual mice in each group. *P<0.05; ***P<0.003. GAPDH, glyceraldehyde-3-phosphate dehydrogenase; NS, nonsignificant.

