Figure 3.
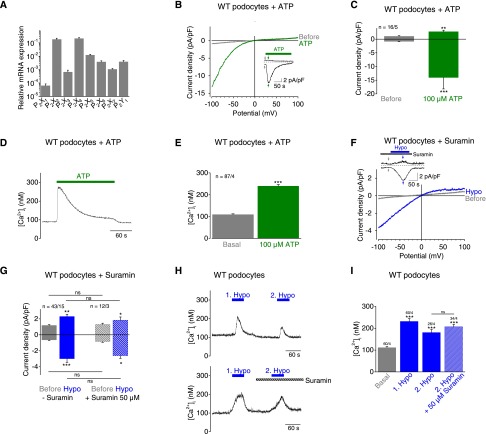
ATP application and mechanical membrane stretch cause similar P2X currents in podocytes. (A) Relative mRNA expression levels of selected GPCRs of primary podocytes determined by quantitative PCR analysis from three independent experiments. (B, C, F, G) Electrophysiologic whole-cell measurements of podocytes. (B and F) Exemplary CDV relationships before (gray) and during (green) application of 100 µM ATP and of hypoosmotic solution “Hypo” in the presence of 50 µM suramin (blue) are displayed. Insets show current density time course at ±100 mV. Stippled lines represent zero current. Application of ATP is indicated. Arrows represent the time points of depicted CDV traces. (C and G) Summary of current densities before (gray bars) and during (green bars) application of ATP and of hypoosmotic solution in the presence (blue hatched bars) and absence (blue bars) of suramin at ±100 mV. (D and E) Fluorimetric calcium measurements with fura-2–loaded podocytes. (D) Exemplary time course of intracellular calcium concentration [Ca2+]i with application of 100 µM ATP is displayed. (E) Summary of [Ca2+]i before (gray bar) and during (green bar) application of ATP. Numbers indicate the numbers of measured cells and of independent experiments. (F and G) Electrophysiologic whole-cell measurements of podocytes. (H and I) Fluorimetric calcium measurements with fura-2–loaded podocytes. (H) Exemplary time courses of [Ca2+]i in the presence (lower panel) and absence (upper panel) of 50 µM suramin during the second hypoosmotic stimulation. Applications of hypoosmotic solution and of suramin are indicated. (I) Summary of [Ca2+]i before (gray bars) and during application of hypoosmotic solution in the presence (blue hatched bar) and absence (blue bars) of suramin. Numbers indicate the numbers of measured cells and of independent experiments. Nonsignificant differences (ns) are indicated. *P<0.05; **P<0.01; ***P<0.001; ns P>0.05.

