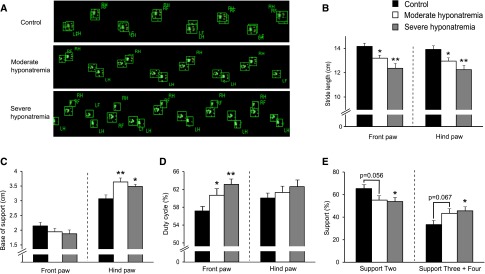
Figure 2.
CatWalk automated gait analysis revealed chronic hyponatremia-induced gait disturbances. (A) Representative footprint images. (B–E) Quantitative analysis of footprint patterns in control (n=9), moderately hyponatremic (n=8) and severely hyponatremic (n=6) rats. (B) Stride length; (C) base of support; (D) duty cycle; and (E) support. One-way ANOVA followed by Fisher’s projected least significant difference test; *P<0.05, **P<0.01 versus control.

