Figure 1.
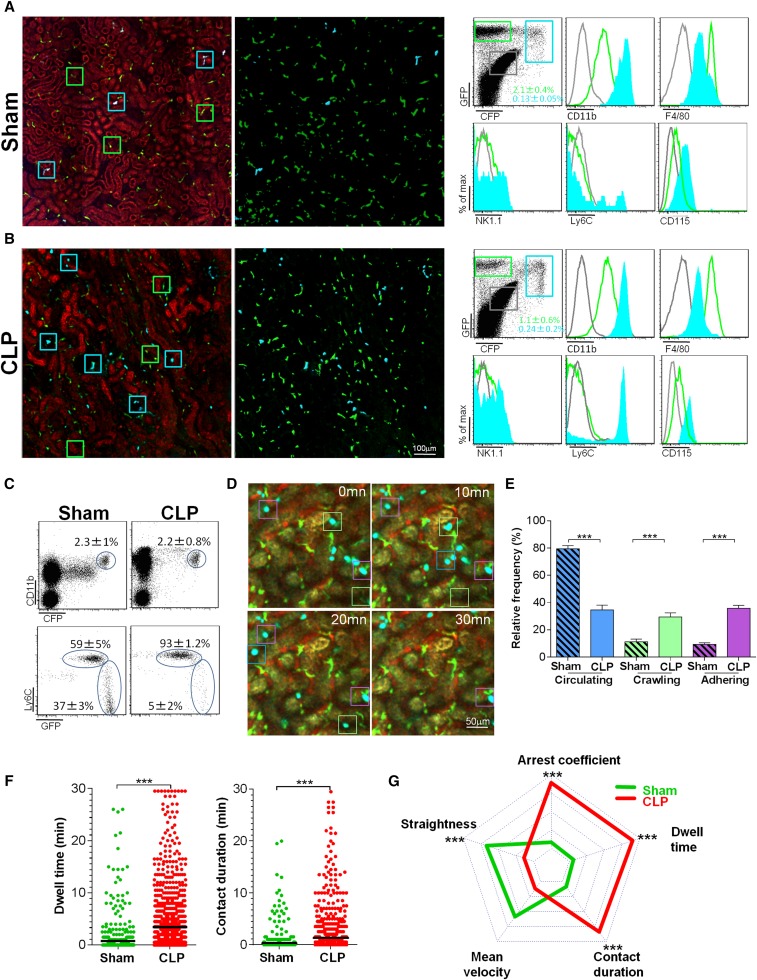
Ly6Chigh monocytes exhibit increased adhesion to the renal endothelium during sepsis. Two-photon laser scanning microscopic images (left) with volume rendering (right) of ECFP+ (cyan squares) and GFP+ (green squares) cells in kidneys of MacBlue×Cx3cr1gfp/+ mice 6 hours after (A) sham or (B) CLP operations. CFP signals are in blue, GFP signals are in green, and autofluorescent renal tubules are in red. Overlay of flow cytometric surface marker expression gated on GFP+ (green histograms) and ECFP+ cells (cyan histograms) in kidneys are shown for each condition. Mean percentages±SD of gated cells are indicated (n=6 mice per group out of three independent experiments). Background staining (gray histograms) gated on nonfluorescent cells is represented. (C) Dot plots represent Ly6C and CX3CR1-GFP expression, gated on blood CD11b+ECFP+ cells 6 hours after sham or CLP operations. Mean percentages±SD of gated cells are indicated (n=6 mice per group out of three independent experiments). (D) Time series two-photon laser scanning microscopic images of kidney cortex of MacBlue×Cx3cr1gfp/+ mice 6 hours after CLP. Examples of circulating (blue squares), crawling (green squares), and adhering monocytes (purple squares) are presented. ECFP signals are in cyan, GFP signals are in green, renal tubules are autofluorescent, and blood vessels are visualized by 2 MDa rhodamine-dextran. (E) Relative frequency of the three behaviors. Bars represent mean±SEM (n=4 sham and n=3 control from independent experiments; ANOVA with Bonferroni adjustment for multiple comparisons were used; ***P<0.001). (F) Dwell time and contact duration with renal endothelium of ECFP+ monocytes. Black bars indicate means. (n=4 sham and n=4 control from independent experiments; Mann-Whitney test were used; ***P<0.001). (G) Radar chart representation shows ECFP+ cell dynamic signatures in sham-operated (green) and CLP-operated (red) mice. Mean values are presented within the 95% confidence interval of the measured value scale for each parameter. Data represent a pool of cells from (n=4 sham and n=4 control from independent experiments; Mann-Whitney test were used; *** P<0.001). (See also Supplemental Figure 1 and Supplemental Movies 1–4).

