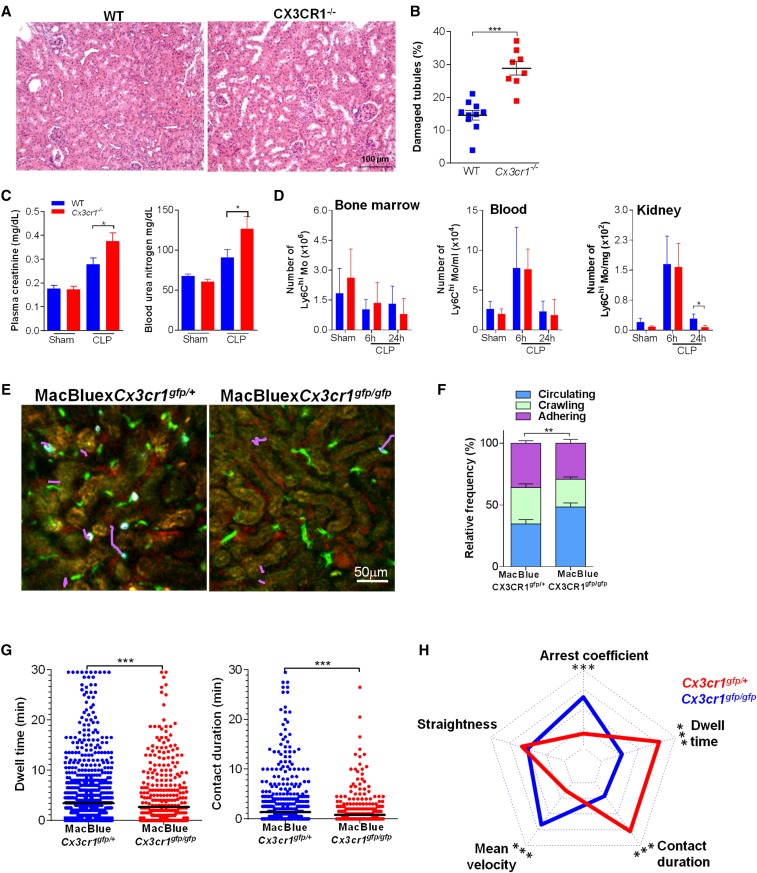
Figure 2.
CX3CR1 promotes Ly6Chigh monocyte adhesion and prevents renal damage during sepsis. (A) Photomicrographs and (B) quantification of kidney histologic lesions 24 hours after CLP in WT (blue) and Cx3cr1−/− mice (red). Bars represent mean±SD (n=10 WT, n=8 Cx3cr1−/−, from at least two repeated experiments; ANOVA with Bonferroni adjustment was used; ***P<0.001). (C) Urea and creatinine measurements in plasma of CLP-operated WT and Cx3cr1−/− mice bars represent mean±SEM (n=10 WT sham, 6 Cx3cr1−/− sham, 15 WT, and 15 Cx3cr1−/− CLP, from at least two repeated experiments; ANOVA with Bonferroni adjustment was used; *P<0.05). (D) Number of Ly6Chigh monocytes in bone marrow, blood, and kidney of WT (blue) and Cx3cr1−/− (red) mice. Bars represent mean±SD (n=10 WT sham, 5 WT CLP at 6 hours, 12 WT CLP at 24 hours, and 6 Cx3cr1−/− sham, CLP at 6 hours, and CLP at 24 hours, from at least two repeated experiments; ANOVA with Bonferroni adjustment was used; *P<0.05). (E) Two-photon laser scanning microscopic images with overlay of monocyte migratory tracks (pink) in kidney cortex of MacBlue×Cx3cr1gfp/+ and MacBlue×Cx3cr1gfp/gfp mice, 6 hours after CLP. ECFP signals are in cyan, GFP signals are in green, renal tubules are autofluorescent, and blood vessels are visualized by 2 MDa rhodamine-dextran. (F) Relative frequency of the three monocyte behaviors in MacBlue×Cx3cr1gfp/+ and MacBluexC×3cr1gfp/gfp mice. Bars represent mean±SEM (n=3 MacBlue×Cx3cr1gfp/+; n=4 MacBluexC×3cr1gfp/gfp from independent experiments; ANOVA with Bonferroni adjustment was used; **P<0.01). (G) Dwell time and contact duration with the renal endothelium of ECFP+Cx3cr1gfp/+ and ECFP+Cx3cr1gfp/gfp monocytes. Black bars indicate means. (H) Radar chart representation shows ECFP+ cell dynamic signatures in CLP-operated MacBlue×Cx3cr1gfp/+ (red) and MacBlue×Cx3cr1gfp/gfp (blue) mice. Mean values are presented within the 95% confidence interval of the measured value scale for each parameter (for all two-photon experiments, n=3 MacBlue×Cx3cr1gfp/+; n=4 MacBluexC×3cr1gfp/gfp from independent experiments; Mann-Whitney test for multiple comparisons was used; ***P<0.001). (See also Supplemental Figure 2 and Supplemental Movie 5).

