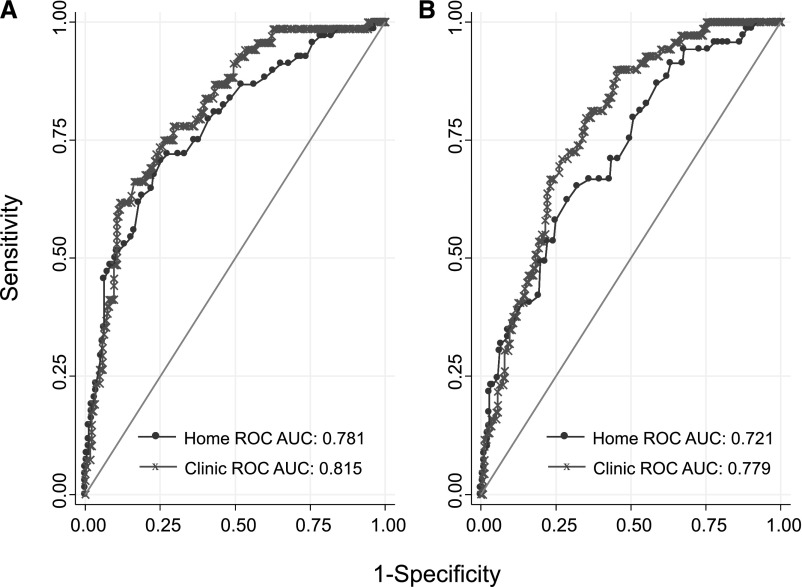
Figure 3.
Receiver operating characteristic (ROC) curves for the diagnosis of MUCH). ROC curves for the diagnostic test performance of systolic clinic and home BP in predicting MUCH diagnosed by daytime ambulatory hypertension (135/85 mmHg) at baseline visit (A) and after 1 month (B). The area under the curve (AUC) for clinic and home BP monitoring were similar (P=0.38 and 0.14, respectively) at each of the two visits.

