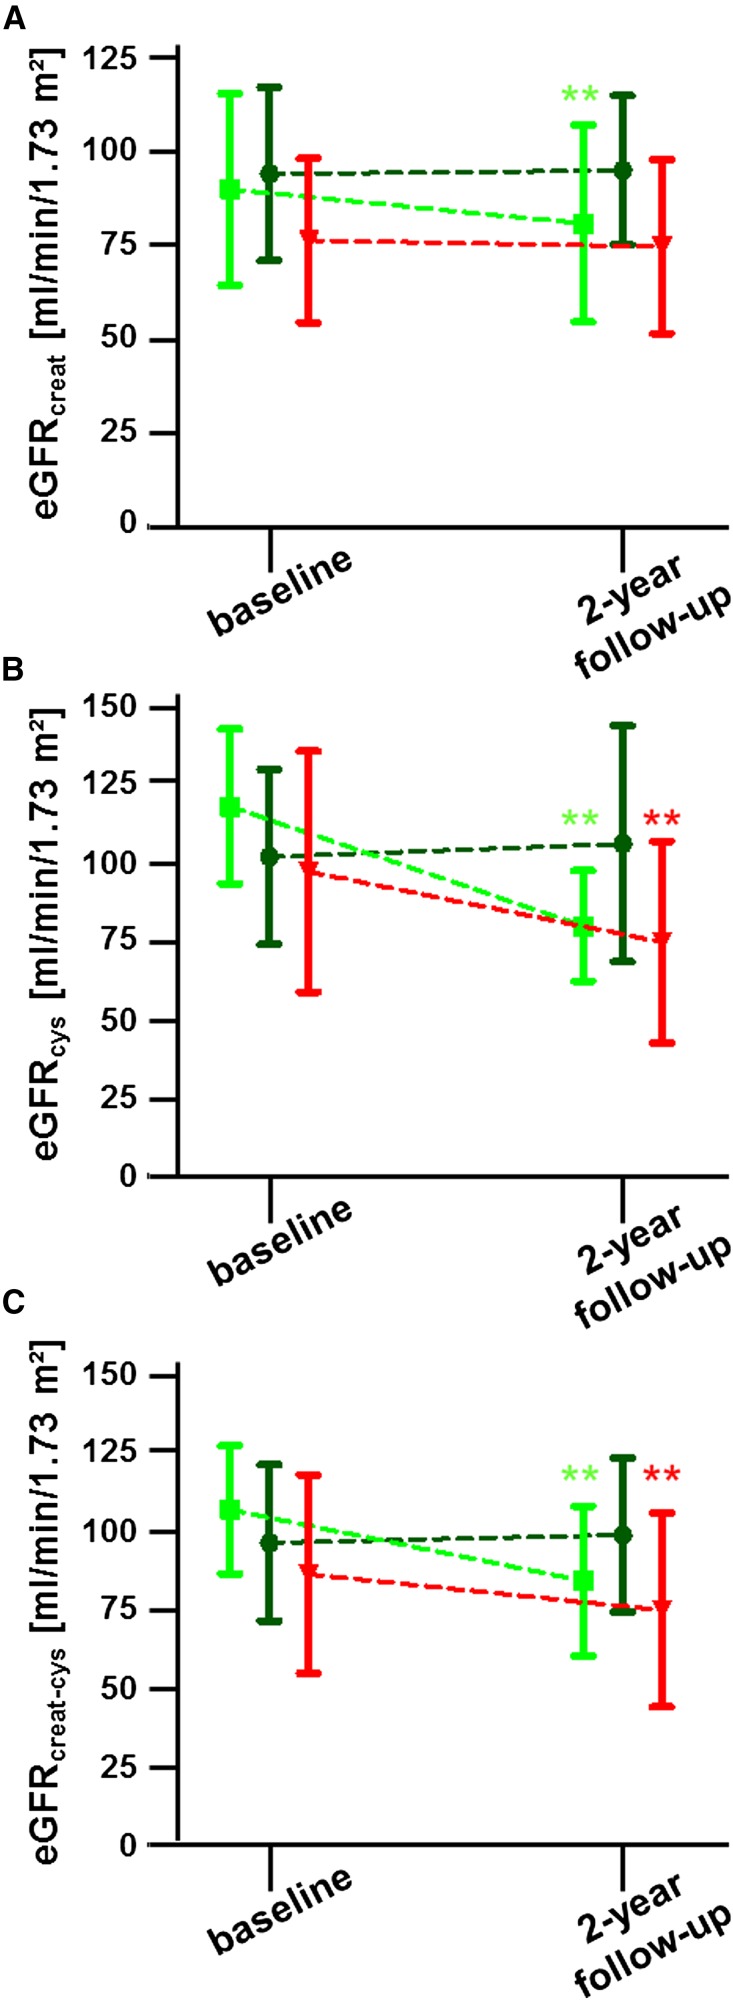
Figure 2.
Changes in renal function quantified by eGFR over time. eGFR was quantified using the CKD-EPI equation on the basis of (A) creatinine (eGFRcreat), (B) cystatin C (eGFRcys), and (C) the combination of both levels (eGFRcreat-cys). Patients under dialysis, with renal transplantation or hyperfiltration (>120 ml/min per 1.73 m2 on the basis of eGFRcreat) have been excluded. Dark green color represents the regular-dose group, bright green color represents the dose-reduction-switch group, and red represents the switch group. Values are given in mean±SD. **P<0.01.

