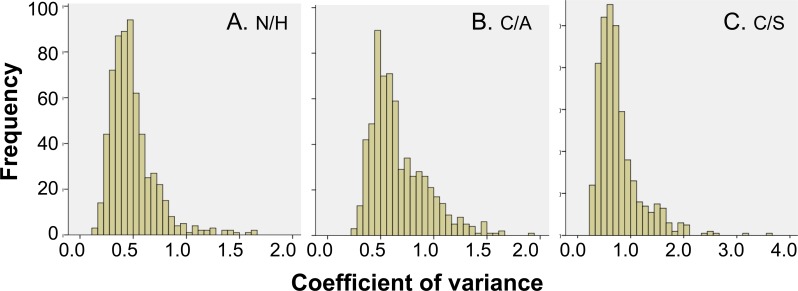
Fig 3. Distribution of variation in abundance of protein spots.
Shown are distribution of coefficient of variation (CoV) values of the standard abundance values for each protein spot identified in PBMCs of N/H controls (30 gels, panel A) and C/A (25 gels, panel B) and C/S (28 gels, panel C) subjects.

