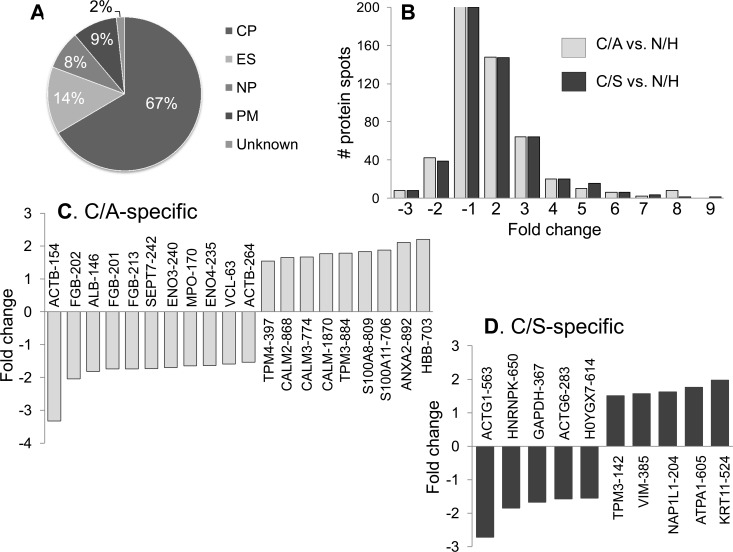
Fig 4. Disease specific proteome signature in chagasic subjects.
(A) Ontological classification of differentially regulated proteins in terms of cellular localization was performed by Ingenuity Pathway Analysis. The compositions of the protein categories are presented as percentages of all individually identified proteins. (B) Shown are the frequency of protein spots that were changed in abundance in clinically-asymptomatic (C/A) and clinically-asymptomatic (C/S) chagasic subjects with respect to normal/healthy (N/H) controls (p<0.05). (C&D) Bar graphs show the protein molecules that were uniquely changed in abundance in C/A (C) and C/S (D) subjects. Data are plotted as fold change in comparison to N/H controls.

