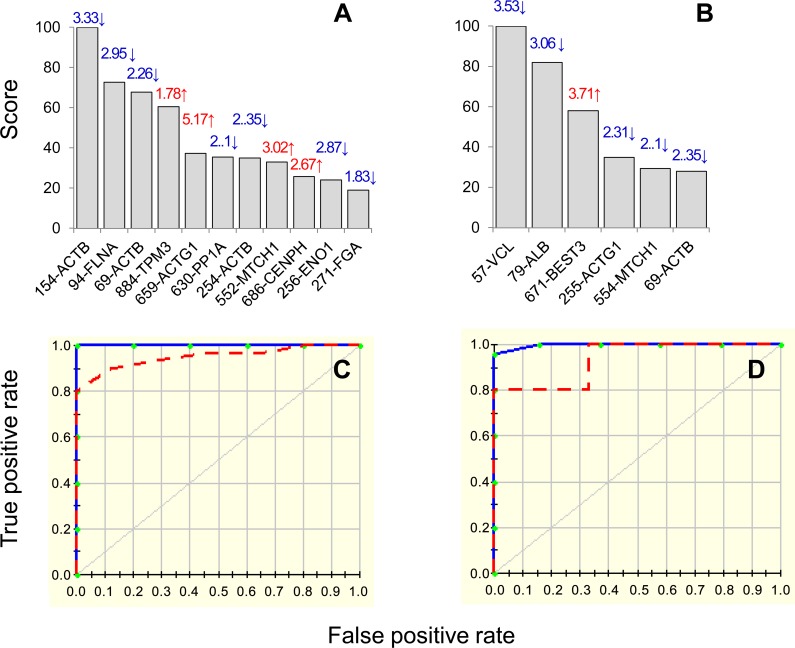
Fig 5. MARS model for classification of seropositive/chagasic subjects.
Input to the model were protein spots that were differentially expressed at p<0.001 (with B-H correction) in seropositive, clinically asymptomatic (84 spots, n = 25) subjects with respect to normal/healthy controls (n = 30). We employed 10-fold cross-validation (A&C) and 80% testing / 20% training (C&D) approaches to assess the fit of the model for testing dataset. Shown are the protein spots identified with high ranking (score >20) by cross-validation (A) and 80/20 (B) approaches for creating the MARS model for classifying C/A subjects from N/H controls. Protein spots in panels A&B are identified as spot #-protein name, and fold change (increase ↑, red; decrease ↓, blue) are plotted on each bar. The ROC curves show the prediction success of the cross-validation (C) and 80/20 models (D). Blue curves: training data ((AUC/ROC: 1.00), red curve: testing data (AUC/ROC: 0.96 for CV and 0.933 for 80/20).

