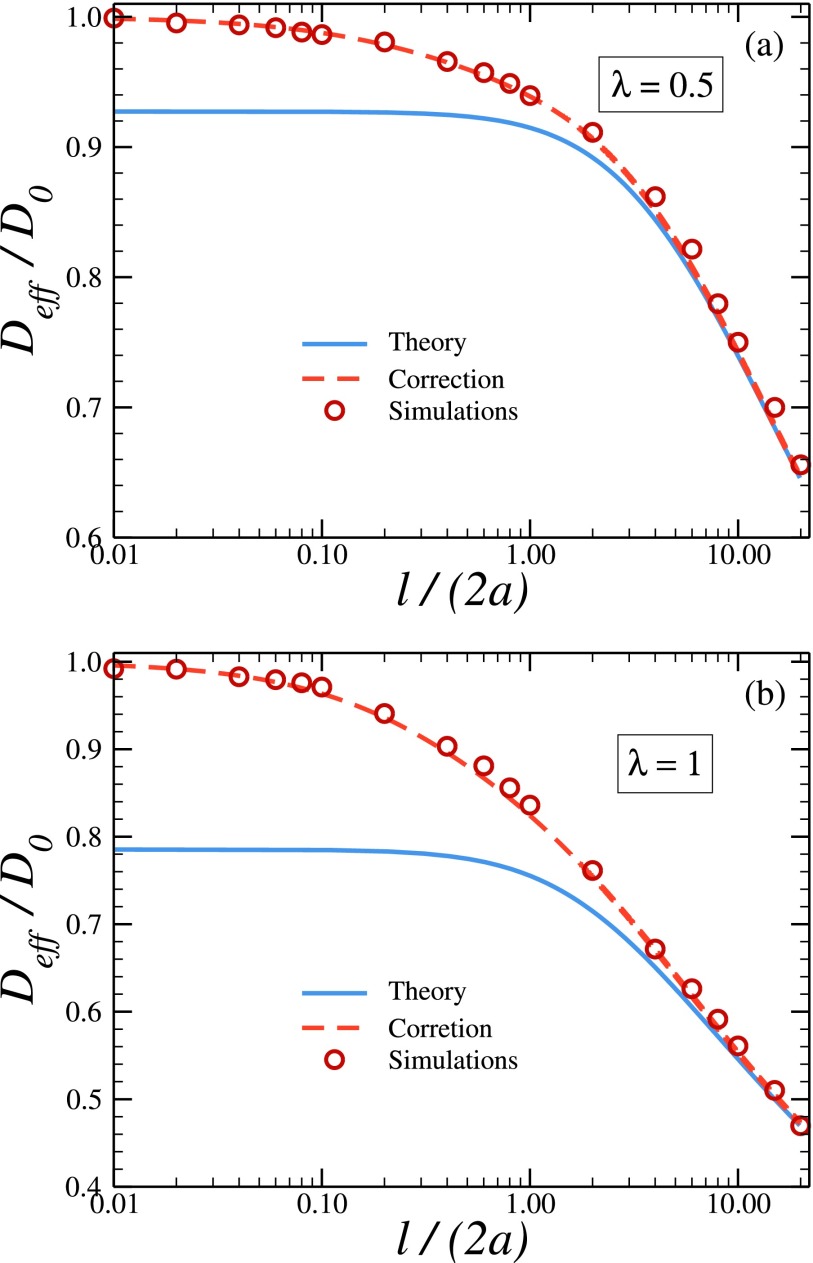
FIG. 2.
Effective diffusivity, Deff, normalized to D0, as a function of the ratio l/a at λ = 0.5 (a) and λ = 1.0 (b). Solid curves are the theoretically predicted dependences drawn using Eq. (2.7) with Dλ given by the KP formula in Eq. (2.9). Symbols are the normalized values of the effective diffusivity obtained from Brownian dynamics simulations. Dashed curves are drawn using Eq. (2.7) with Dλ replaced by Dλ,γ given in Eq. (3.2), where Dλ is given by the KP formula in Eq. (2.9).

