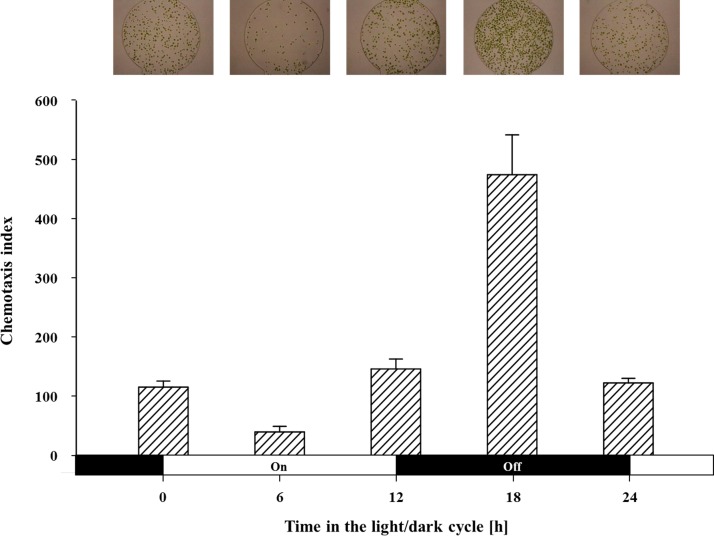
FIG. 5.
The chemotaxis index of the cells synchronized to Light (on): Dark (off) (12 h:12 h) cycle. The chemotactic response was assayed for 1 h using the cells sampled every 6 h. Chemotaxis to HCO3− showed the maximum level at the middle of the dark period (18 h) and the minimum level during the day phase (6 h). The upper images show the representative images of the attracted cells at each sampling time. Data are the mean (bar graph) and standard deviation (error bars) of three biological replicates (n = 3).

