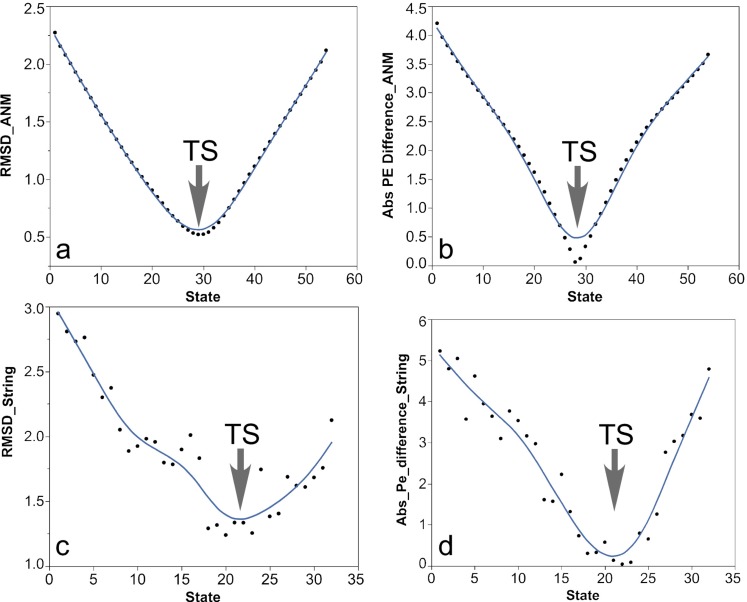
FIG. 4.
The ANMPathway trajectory and the string trajectories were compared with the PATH trajectory. In (a), we calculated the RMSD between the transition state from the PATH trajectory and all the states along the ANMPathway trajectory. States 28–31 are structurally similar to the PATH transition state. In (b), we calculated the potential energy (PE) of each state in the ANMPathway trajectory with respect to the potential energy well of the initial and the final state and their absolute difference was plotted. States 27–30 have the lowest potential energy difference, which coincides with the states in (a). We performed a similar comparison between the string trajectory (G3c) and the PATH transition states in (c) and (d). States 18–23 are structurally similar to PATH transition state, and the same states also have the lowest potential energy difference, implying their proximity to the same transition state.

