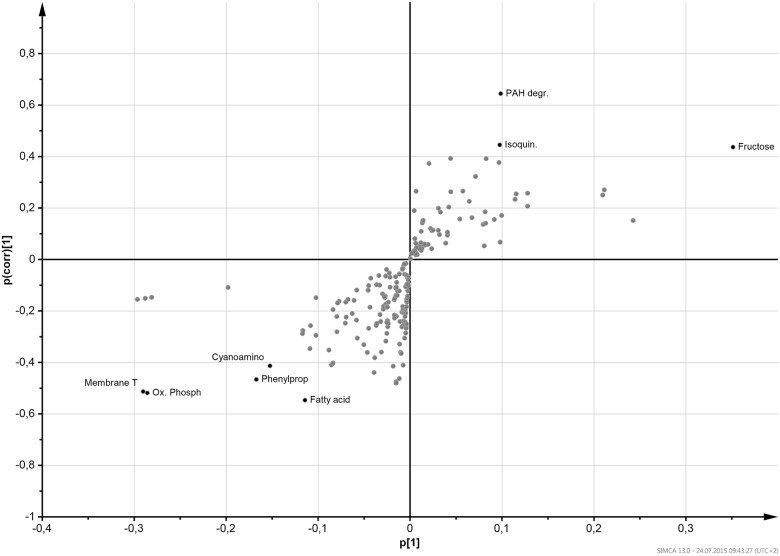
Fig 5. S-plot of the OPLS-DA model showing pathways associated with sustained weight loss over the whole study period.
Each pathway is displayed as a dot. Dots located in the top-right corner of the figure are potential markers for non-persistent weight loss, whereas those located in the bottom-left corner are associated with sustained weight loss. On the x-axis, the loading (p|1|) is indicated, which is a measure for the influence of the variable on the model. On the y-axis, the p(corr)|1| is indicated, which is a measure of the reliability of a variable as a marker. The strongest marker (defined as |p| > 0.09 and |p(corr)| > 0.4) are labeled and displayed in black color, the other pathways are displayed without labels in grey. Abbreviations: Fructose, “fructose and mannose metabolism”; Isoquin., “isoquinoline alkaloid biosynthesis”; PAH degr.,”polycyclic aromatic hydrocarbon degradation”; Fatty acid, “fatty acid metabolism”; Phenylprop, “phenylpropanoid biosynthesis”, Cyanoamino, “cyanoamino acid metabolism”; Membrane T, “membrane transport”, Ox. Phosph, “oxidative phosphorylation” pathway. Statistics: The model is based on the following characteristics: 1+2 components, R2X = 0.53, R2Y = 0.496, Q2 = 0.277, pcv-ANOVA = 1.73x10⁻⁴. Because of low Q2, permutations of the data were performed before running again the OPLS-DA. This lead each time to the same model.

